The example dataset used in this example is a dataset of liver transcription factors (TFs) from Krivan's group. Since TFs in this dataset are quite well studied, it's often used as a standard test set for algorithms and software in TF finding. There are 12 genes and 4 TFs (C/EBP, HNF-1, HNF-3 and HNF-4) in this liver dataset. The promoter regions of each gene could be bounded by one or more of the 4 TFs. The annotations of the liver dataset are shown in Table 1. The first column is for the gene names, the second column is for the start positions of TF binding sites, the third column is for the end positions and the last column shows the names of TFs.
Table1. Liver set
1. Command line mode
In command line mode, first we need to prepare two files para.txt and testseq.txt for running this program.
Then we run command "perl src/iteration.pl 0" and get result file result.txt as in the following figure.

Figure1. Result file result.txt
2. With graphic interface
With graphic interface, only testseq.txt needs to be prepared. In Linux graphic environment, you can open the FlexSA graphic interface by double click FlexSA.jar or by run command "java -jar FlexSA.jar".
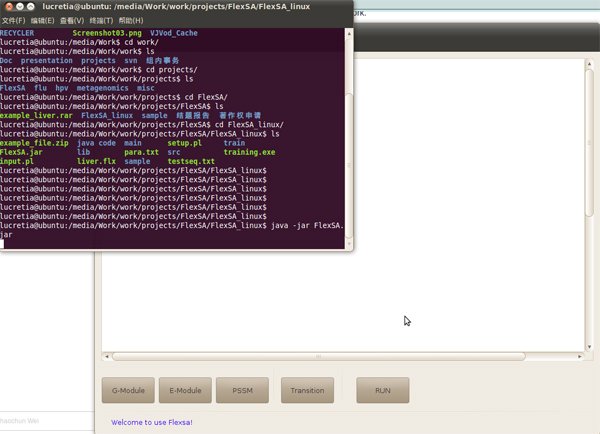
Figure2. Open graphic interface of FlexSA
In this example, parameters could be defined by a figure like this, users can draw it or use "File" menu to open an .flx file. In our case, we open a pre-created diagram file liver.flx.
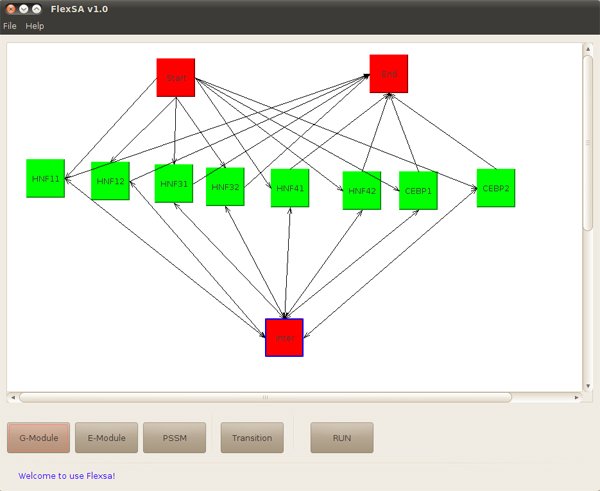
Figure3. Parameters defined by a figure
By click button "RUN", we get a text description of the figure.
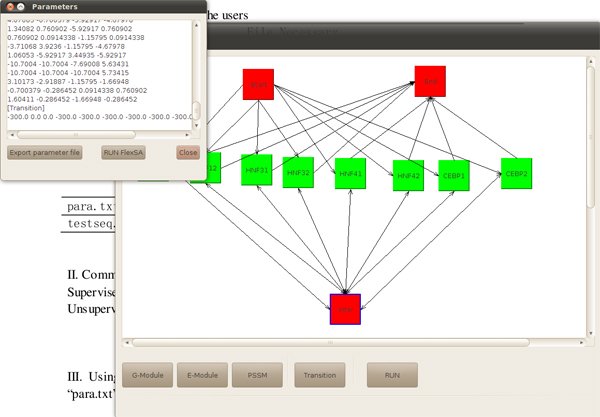
Figure4. Text description of the figure
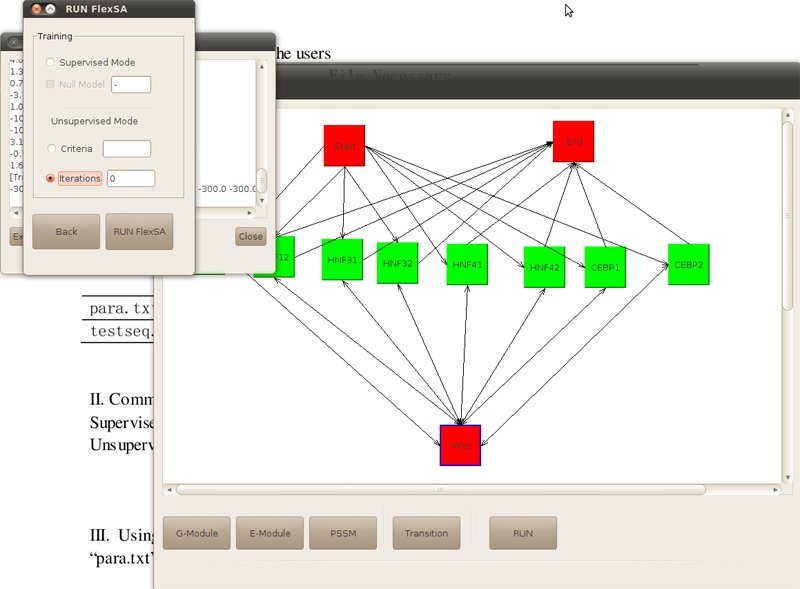
By click button "Export parameter file", a parameter file will be saved as para.txt. By click button "RUN FlexSA", we can continue running the program. In this case, we choose unsupervised method, and set iteration as 0, then click again "RUN FLexSA".
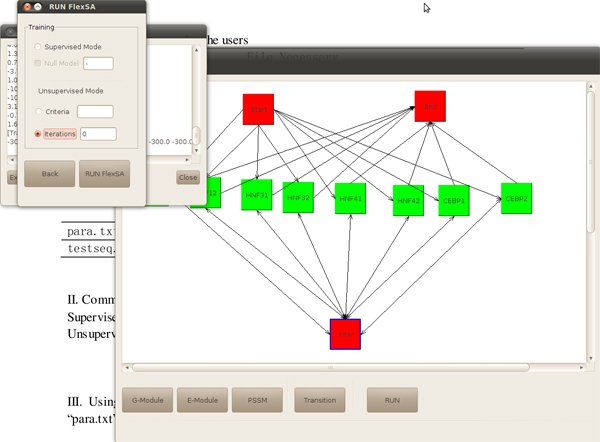
Figure5. Choose running method and set parameter
Finally, FlexSA output a result file named result.txt just like command line mode.
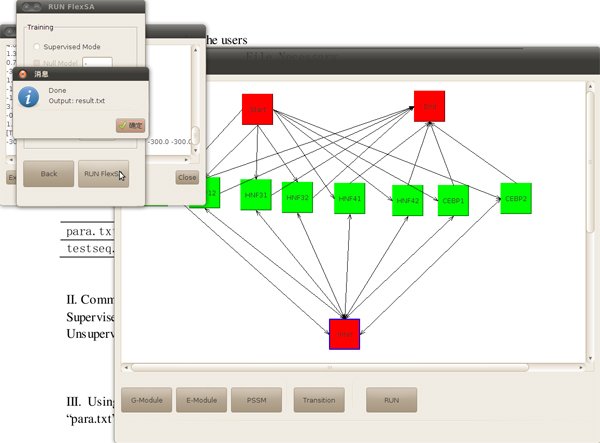
Figure6. When finished, an info window will jump out.
This result is only a draft, in final.txt, we keep the top 10 high score results, and in our paper, we choose the top 4 as our predictions.

Figure7. Result after filtering
|