About 3K Rice Pan-genome
Pan-genome analysis were carried out for the 3,010 rice accessions. First, we built a comprehensive dataset of rice sequences by combining IRGSP reference and de novo assembled contigs from 3,010 deep sequencing rice genomes. It showed rice as a species contains almost as twice genome sequence contents as an individual rice genome. 15,362 genes were predicted on these sequences. The presence/absence variation of each gene was detected for 453 rice accessions with sequencing coverage higher than 20. Phylogenetic study based on these variation was carried out. All rice were grouped based on the phylogenetic study and between-group variations were further studied. The distributed genes not included in the reference genome have important functions, such as those response to freezing and cold acclimation. The pan-genome analysis of the 3K rice genomes revealed the variation among different rice accessions.
Citing RPAN
If you use RPAN in a project that you publish, please cite the most recent RPAN paper, which is here in Nucleic Acids Research.
User Manual
Introduction
The cultivated rice, Oryza sativa L., is one of the major staple food for the world and a model organism in plant biology. The 3,000(3K) Rice Genome Project gives us an opportunity to gain insight into the genome diversity within the O. sativa gene pool. Comprehensive analyses of 3,010 rice genomes revealed the population organization of the genome variation in the rice pan-genome. RPAN presents analysis results from 3K rice genome data, focusing on gene presence/absence variation (PAV), which provides new perspective for rice researchers and breeding experts.
RPAN includes the following data:
- Basic information of the 3,010 rice accessions, including accession names, sequencing depths, mapping depths on the IRGSP-1.0 genome and meta-information such as geological locations, subspecies (or subgroups) categorizations, etc.
- Sequences and gene annotations for the rice pan-genome, including a total of 50,995 full-length coding genes and protein coding sequences and protein sequences of all these genes.
- Gene presence/absence variations (PAVs). The presence/absence of genes in the rice pan-genome were determined by 453 high-quality accessions. All genes were then categorized as core, candidate core or different types of distributed genes. In total, there are 23,914 core genes, 4,986 candidate core genes and 22,095 distributed genes. Of the distributed genes, 853 genes are subspecies or varietal group specific, including 587, 147, 67 and 52 genes for Indica and Japonica subspecies, Aus and Aro groups, respectively.
- Genome-wide expression profiles for the rice pan-genome, including expression data from 226 publicly available RNA-seq runs.
RPAN also provides the following analysis tools:
- Basic search functions:
- Search a single gene (with its gene ID) to obtain its basic information, distributions, PAVs and gene functions.
- Search a single rice accession (with its accession code) to obtain its sequencing landscape and meta-information (geological location, subspecies categorization, etc).
- Search nucleotide sequence(s) against the rice pan-genome. A BLAT search server with the rice pan-genome as the reference sequence was deployed in RPAN. A sequence or multiple sequences in FASTA format can be searched. All hit regions in the rice pan-genome will be returned and can be visualized in the genome browser.
- Advanced search functions:
- Search multiple rice accessions to obtain their shared genes.
- Search multiple genes to obtain rice accessions in which they are all present.
- Visualization functions:
- A tree browser visualizes the phylogeny of the 3,010 rice accessions. It also allows users to select the tracks which can then be visualized directly in the genome browser. The phylogenetic tree was constructed based on SNPs.
- The genome browser was built based on JBrowse to visualize genome sequences, gene annotations, gene expressions, and presence-absence variations (PAVs). Users can search accession ID or any text related to the tracks information in tracks selection panel. Searched results can be saved as a custom track for a subsequent comparison.
Terminology
The reference pan-genome
The reference pan-genome was constructed on the IRGSP genome and the non-redundant unaligned contigs. All these contigs were grouped into 12 groups according to the classification of their corresponding rice accessions. These groups include four subgroups (IG1, IG2, IG3, IG4, IG5) of subspecies Indica, AUSG6, four subgroups (JG7, JG8, JG9, JG10) of subspecies Japonica, AROG11 and admixtures (Adm). The contigs from the same group were concatenated with 100 consecutive Ns as delimiters. Finally, the IRGSP genome and these pseudo-chromosomes were merged as the reference pan-genome. All the contents in RPAN are based on this reference.
High quality Accessions
453 high quality genomes with sequencing depths >20x and mapping depths >15x were chosen for detailed Pan-genome analyses.
To get the list of high quality accessions, visit rice table page and check "Yes" in the "High quality accessions" option.

Figure 1. High quality accession criterion.
Gene Categorization
| Core genes | Genes which exist in all high-quality rice accessions |
| Distributed genes | Genes which exist in significantly less than 99% of accessions (binomial tests, p-value < 0.05, null hypothesis is “loss rate < 1%”) |
| Candidate Core genes | Genes which exist in > 99% (not all) of high-quality rice accessions (binomial test, fdr < 0.05) |
| Subspecies-unbalanced genes | Distributed genes whose frequency in one or more subspecies is significantly higher than that in other subspecies (Fisher's test, FDR < 0.05) |
| Indica-dominant genes | Subspecies-unbalanced genes whose frequencies in Indica is 5% greater than their frequencies in Japonica |
| Japonica-dominant genes | Subspecies-unbalanced genes whose frequencies in Japonica is 5% greater than their frequencies in Indica |
| Subspecies-specific genes | Distributed genes which exist in a subspecies but absent in all other subspecies |
| Indica-specific genes | genes only exist in Indica |
| Japonica-specific genes | genes only exist in Japonica |
| AUS-specific genes | genes only exist in AUS |
| ARO-specific genes | genes only exist in ARO |
| Subgroup-unbalanced genes | Distributed genes whose frequency in one or more sub-groups of a subspecies is significantly higher than the frequencies in other sub-groups in this subspecies. |
| Indica-subgroup-unbalanced genes | Distributed genes which are abundant (or have significantly higer frequencies) in specific Indica subgroup(s) but have low frequencies in the other Indica subgroup(s) (Fisher's test, FDR < 0.05) |
| Japonica-subgroup-unbalanced genes | Distributed genes which are abundant (or have significantly higer frequencies) in specific Japonica subgroup(s) but have low frequencies in the other Japonica subgroup(s) (Fisher's test, FDR < 0.05) |
| Random genes | Distributed genes which show no difference among gorups and sub-groups (genes are not core, candidate core, subspecies unbalanced and sub-group unbalanced) |
Phylogenetic tree
The phylogenetic tree was constructed based on PAVs among 453 high quality accessions.
Through the gene distribution tree of single gene search result, users could find the presence of this gene on phylogenetic tree directly. Users could also compare this tree with the tree with classification and geographical distribution labeled below.

Figure 2. Phylogenetic tree of 453 high quality accessions.
Basic Search
Search by a gene ID
Users can type a gene ID (e.g. Os02g0561500) in the search box. After clicking the "Search" button, a new page will display search results. The results consist of seven parts: basic gene information, gene categorization, gene distribution, gene presence frequency, gene ontology, CDS and protein sequence.
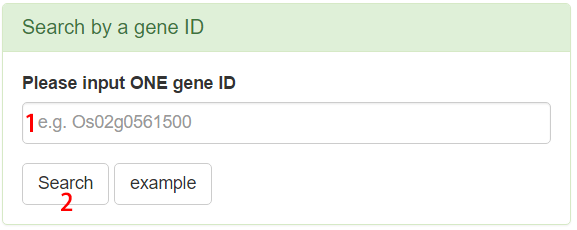
Figure 3. Example of search by a gene ID.
Basic gene information includes:
- ID: database ID
- source: IRGSP or maker
- chrom: chromosome number
- start: start coordinate in the chromosome
- end: end coordinate in the chromosome
- CDS length: the length of coding DNA sequence
- exon number: the number of exons
- gene ID: the accession number in RAP-DB
- visualization: to visualize this gene in genome browser
Gene categorization
- See terminology.
Gene presence frequency
- The first heatmap indicates the presence frequency in subspecies of this gene.
- The second heatmap indicates the presence frequency in subgroups of this gene.
Gene ontology
- GO term ID and name of this gene. Users can click the ID to get detailed information.
CDS
- Coding DNA sequence in FASTA format.
Protein sequence
- Protein sequence in FASTA format.
Search by DNA sequence
Users can also search with genomic sequences against the rice pan-genome directly. One or more sequences in the FASTA format can be searched. All alignments can be further checked in a detailed page by clicking the "Genome Browser" button in the record line and visualized in the pan-genome browser.
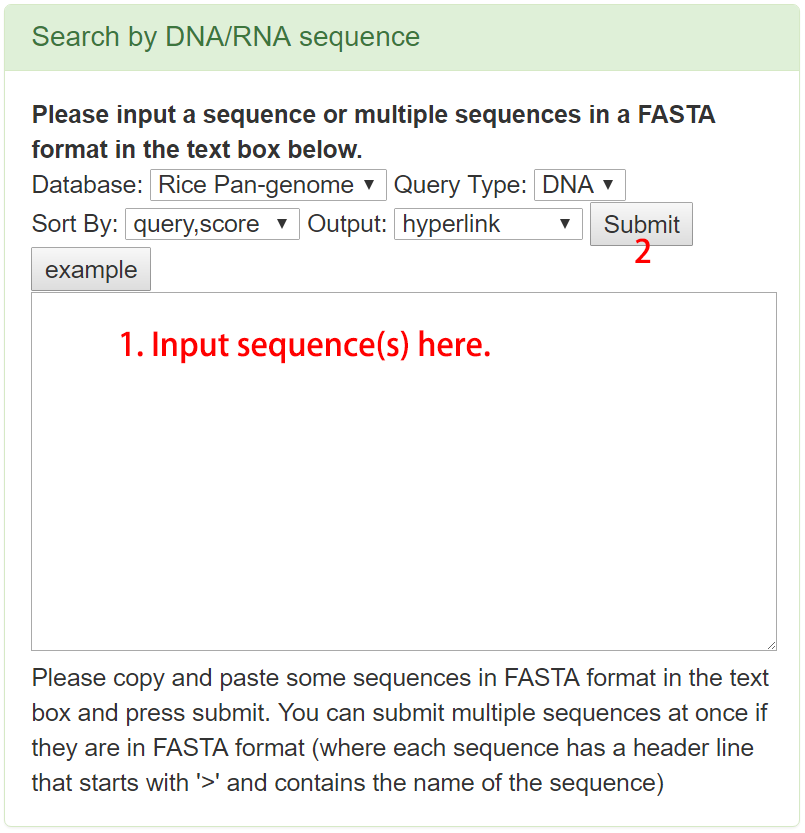
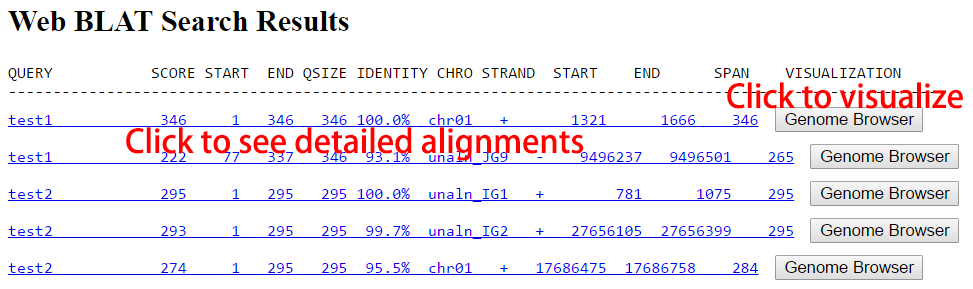
Figure 4. Example of search by DNA sequences.
Search by one rice accession
Users can type an accession code (e.g. B001) into the search box. After clicking the “Search” button, a new page will display search results. The results consist of three parts: basic rice accession information and statistics of genes’ categorizations in this rice accession.
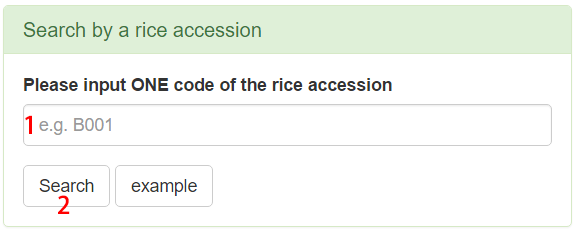
Figure 5. Example of search by a rice accession.
Basic rice information includes:
- ID: accession ID in RPAN
- code: code of accession
- name: variety name
- meta-information-based subspecies: subspecies categorization by meta information, including JAP(japonica), IND(indica), AUS(aus/boro), ADM(admixed), ARO(aromatic basmati/sadri), TROP(tropical japonica) and TEMP(temperate japonicas)
- SNP-based subspecies: subspecies categorization by SNP analysis: including JAP, IND, AUS, ARO and ADM
- SNP-based subgroup: subgroup categorization by SNP analysis: including IG1, IG2, IG3, IG4, IG5, AUSG6, JG7, JG8, JG9, JG10, AROG11 and Adm
- country: source country of the accession
- region: region of the rice accession, including AFR(Africa), AME(America), EAS(East Asia), EUR(Europe), OCE(Oceania), SAS(South Asia), SEA(Southeast Asia), WAS(West Asia), WEU(West Europe), NA(not available)
- sequencing depth
- mapping depth: the value of the total size of mapped reads divided by the length of IRGSP 1.0 genome
- mapping coverage: the percentage of the IRGSP 1.0 reference genome covered by mapped reads
Gene statistics
- The table summarizes the numbers of genes in different categorizations.
- The three pie charts show the percentage of gene categorizations at different levels, including core/distributed, specific and unbalanced..
Advanced Search
Search by rice list to obtain their shared genes
Users can input multiple accession codes in the search box or upload a file containing accession codes. The least number of rice accessions sharing a specific gene can be an optional parameter. If this number is set to 1, the search result will be all genes existing in all the input accessions; similarly, if the number is set to the number of all input accessions, the core genes of all input accessions would be acquired. Then, the basic information of these accessions and the resulted genes could be downloaded and the statistics tables and charts for these genes are also provided.
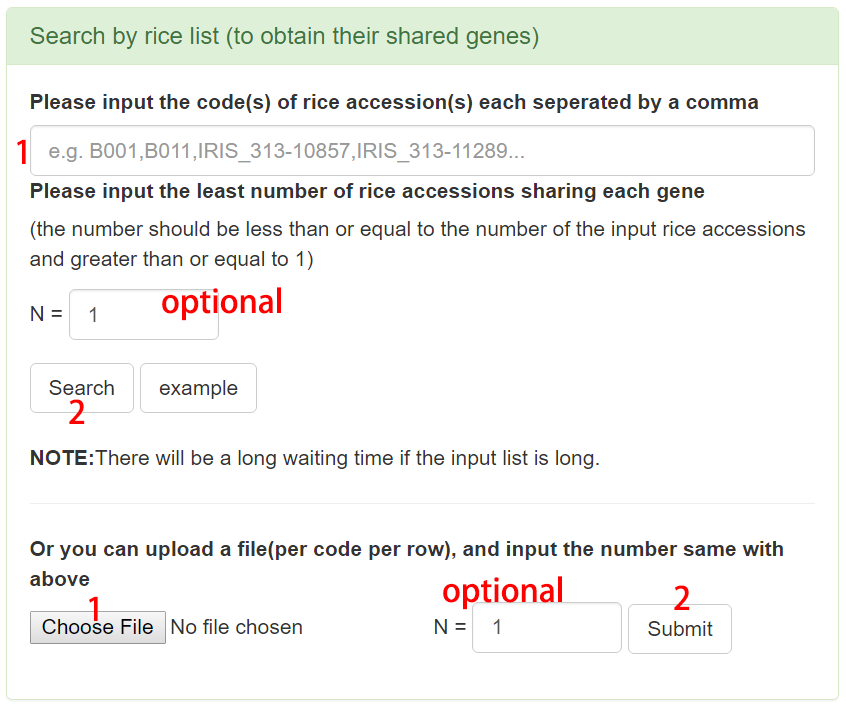
Figure 6. Example of search by rice list.
- Basic rice information: click button to download information of the input rice.
- Rice distribution: histogram of the accession numbers of subspecies.
- Basic gene information: click button to download information of the shared genes.
- Gene statistics: The table summarizes the numbers of categorizations of shared genes. The three pie charts show the percentage of gene categorizations at different levels.
Search by gene ID list to obtain rice accessions where they all present
Users can type multiple gene IDs into the search box or upload a file containing gene IDs. Then, the basic information of rice accessions where these gene IDs all present and the input genes could be downloaded and the statistics tables and charts for these genes are also provided.
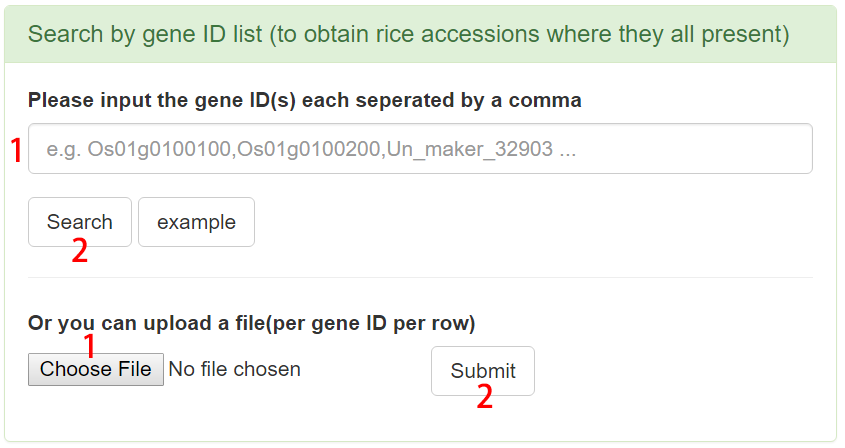
Figure 7. Example of Search by gene ID list.
- Basic rice information: click button to download information of the rice where all input genes present.
- Rice distribution: histogram of the accession numbers of subspecies.
- Basic gene information: click button to download information of the input genes.
- Gene statistics: The table summarizes the numbers of categorizations of the input genes. The three pie charts show the percentage of gene categorizations at different levels.
Table Browser
All information in the pan-genome browser was stored in tables that can be downloaded. These tables include the rice accession information table, the genome annotation table and gene expression profile table.
Rice Accession Table
In the rice accession information table, users can filter the results by selecting browse options such as categories, geological regions and sequencing depth status (high/low). Attention: the result is the intersection of all the options. A summary table can be generated for filtered results.
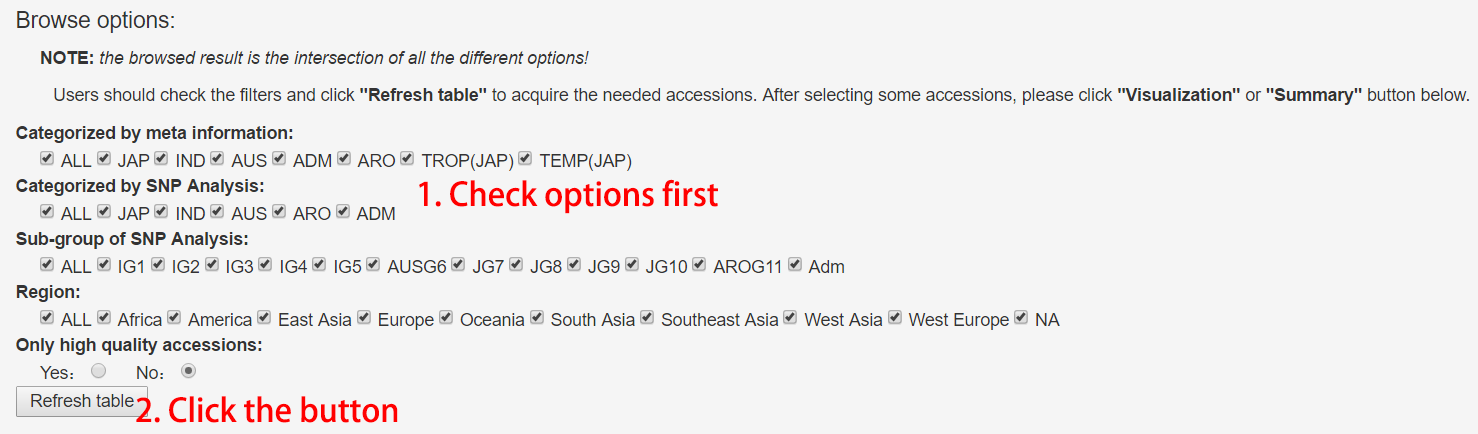
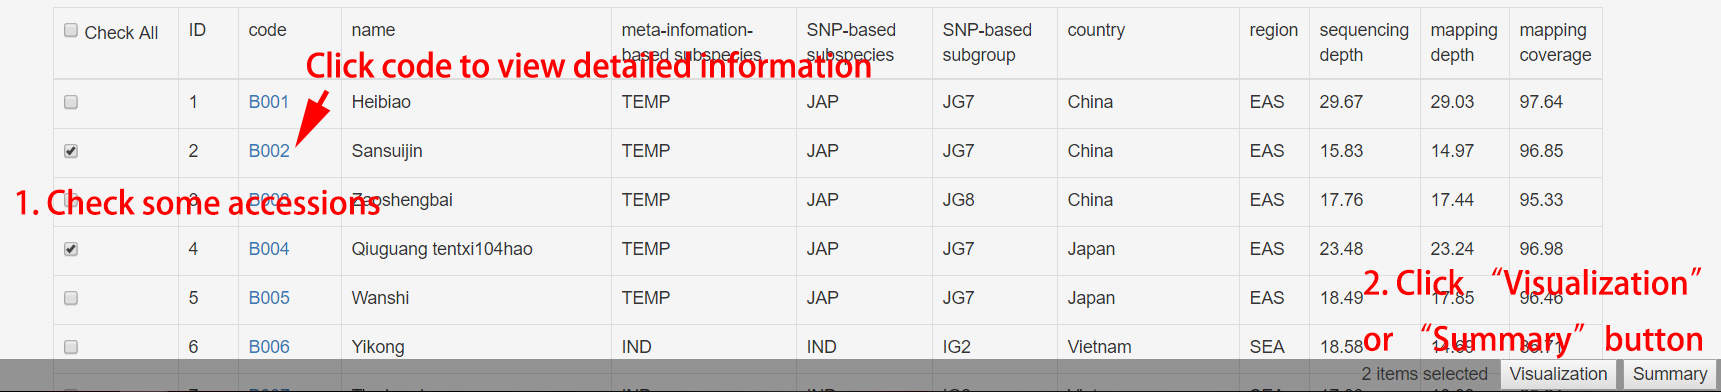
Figure 8. Usage of rice accession table.
For visualization, please ref visualization part.
For summary, it is same with search multiple rice accessions.
Gene Table
In the gene information table, there are 50,995 full length genes. The basic gene information including chromosome positions on the reference IRGSP-1.0 genome, strand, CDS length and exon number, are contained in the table. Detailed gene information, such as gene categorization (core/distributed), gene presence frequency, gene ontology, coding sequence, and protein sequence, and visualization could be acquired by clicking the related links. The location of a genomic region can also be searched in a format of “chromosome ID: start coordinate-end coordinate”.

Figure 9. Usage of gene table.
Expression Profile Table
A total of 226 runs of RNA-seq data from diverse rice tissues were collected. The detailed information of gene expression profiles could be acquired and visualized in the genome browser.
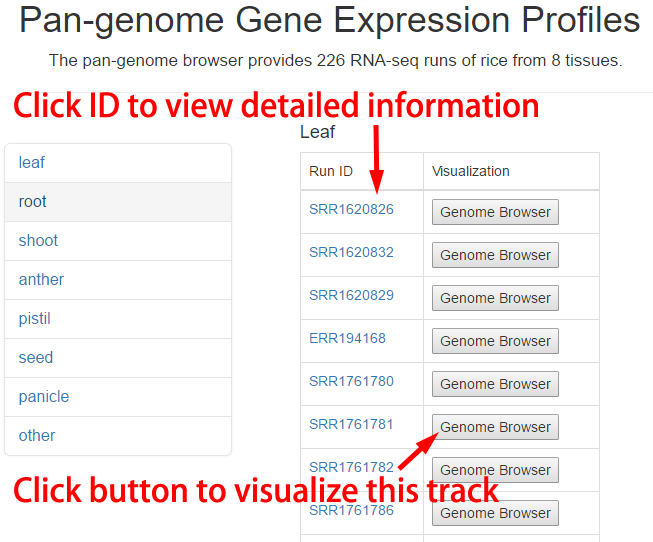
Figure 10. Usage of expression profile table.
Visualization
Introduction
The visualization page contains two parts, a dynamic tree browser on the left panel and a genome browser on the right panel. The tree was constructed from the SNP data. Users can select multiple nodes (including leaf nodes and internal nodes) and click the “Submit” button to visualize these rice accessions in the genome browser. The tree browser also supports search function to accelerate target genome selection. The pan-genome reference sequence, gene annotation and overall presence frequency of high quality accession are three basic tracks. There are 3,010 rice genome tracks and 226 RNA-seq tracks. Users can select any number of accessions or expression data through the hidden “Select tracks” panel or the tree browser as well. For the performance concern, we recommend to select less than 300 tracks each time.
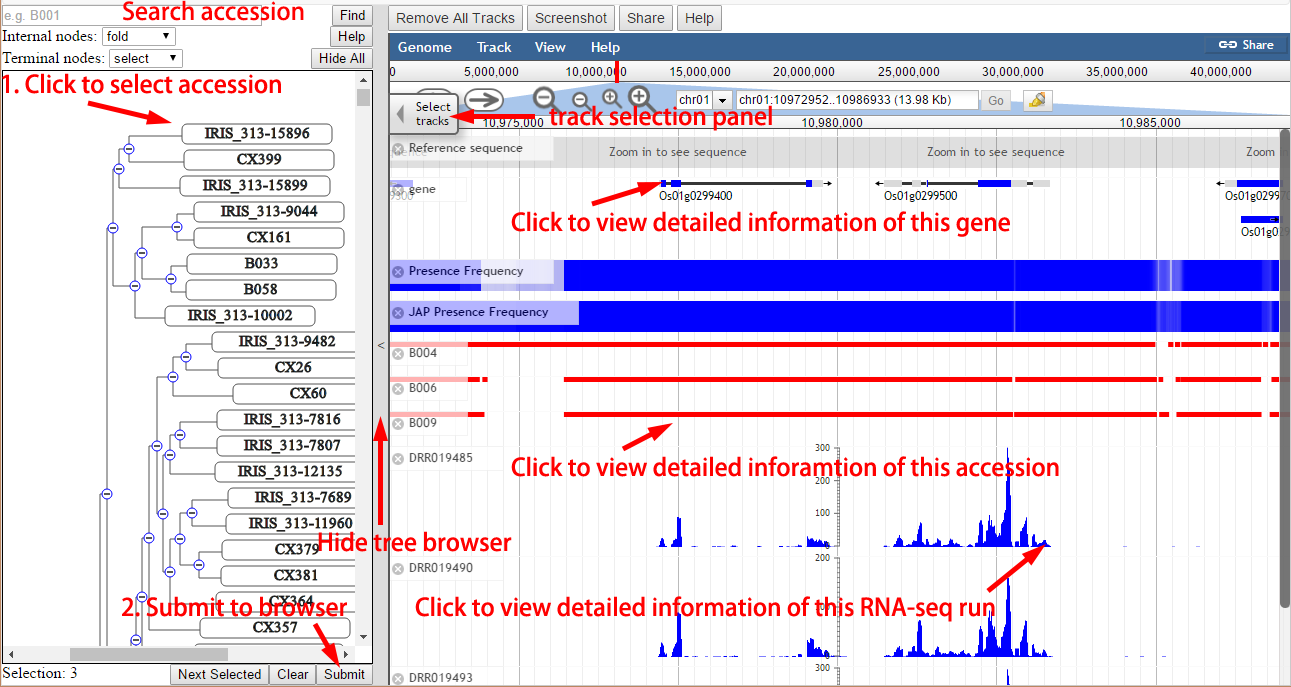
Figure 11. Usage of browsers.
Tree Browser
The tree browser is composed of a tree viewer and 4 toolbars, one of which lies at the bottom of the browser. The top toolbar is for locating the terminal nodes by accession codes.
The next two toolbars change the behaviors of internal nodes and leaf nodes respectively. When "fold" is chosen, clicking internal nodes hides their child nodes. When "select" is chosen, clicking nodes select their child nodes (or themselves when clicking leaf nodes). A selected leaf node will be shown in genome browser when the "submit" button is clicked. When "preserve" is chosen, clicking nodes preserve their child nodes (or themselves when clicking leaf nodes). A preserved leaf node won't be hidden when folding its ancestors. Clicking a node for the second time behave oppositely in every chosen 'mode'.
The last toolbar lies at bottom. It provides functions on selection. Clicking the "Next Selected" button scrolls the tree browser down to the location of the next selected leaf node. Clicking the "clear" button deselects all selected accessions. Clicking the "submit" buttons shows selected accessions in genome browser. Clicking the "Help" button shows description about the usage of each button. Clicking the "Hide All" button hides all internal nodes.
Genome Browser
The genome browser was based on JBrowse. The detailed usage of JBrowse could be acquired in the JBrowse official site.
There are four buttons on the top of this panel.
- Remove all tracks: remove all shown tracks in the browser, except for 3 basic tracks (Reference sequence, gene, Presence Frequency).
- Screenshot: generates a screenshot for JBrowse in PDF format.
- Share: share the link of current genome browser.
- Help: View this manual.
There are five types of tracks, including “reference sequence”, “gene”, “presence frequency”, accession and RNA-seq, and the first three types are default tracks.
- Reference sequence: the pan-genome sequence. Users could zoom in to see sequence at base level.
- Gene: the pan-genome gene annotation. Users could left-click genes to search in RPAN and right-click to view detailed information.
- Presence frequency: the presence frequency of high quality accession. There are five tracks, including the presence frequency of overall, JAP, IND, ARO and AUS.
- Accession: there are 3,010 accession tracks. Users could click the red lines to search in RPAN.
- RNA-seq: there 226 RNA-seq tracks. Users could click the blue plot to view detailed information about this run.
Download
The reference pan-genome sequence and annotation are available on download page.
Upadate logs
- 2018.2.11 version 0.91
- Corrected the gene pav heatmap figure in the homepage. The previous one was actually based on gene family, which was marked as gene pav by mistake.
- removed the gene age figure in the about page, and updated the about page.
- 2016.8.10 version 0.9 released
- reconstruct tree browser
- add toolbar to visualization page
- other minor improvements and bug fixes
- 2016.5.5 version 0.8 released
- 2016.4.13 version 0.7 released
- 2016.4.1 version 0.6 released
- 2015.12.29 version 0.5 released
- 2015.12.19 version 0.4 released
- 2015.9.28 version 0.3 released
- 2015.8.13 version 0.2 released
- 2015.7.6 version 0.1 released
Database update
Database update
Database update
Add expression data
Add detailed information for genes
Database update
Database update