Introduction
Rice is one of the most important food crops globally, widely cultivated and consumed by billions of people. In the past, we created the Rice Pangenome Browser (RPAN) to present the linear pangenome derived from ~3,000 Rice Genomes generated by short-read sequencing technologies in 2017. It provided an important genetic resource for rice biology and breeding. However, with the progress of long-read (also called the third-generation) sequencing technologies, a wealth of individual genomes with much higher quality have been generated, enabling the construction of more complete pangenomes. Here, we present RPAN2, an updated version of RPAN, which preserves the existing short-read data from its predecessor and integrates additional pangenomes from long-read data, including a linear pangenome and a graph-based pangenome with new visualization methods.
RPAN2 includes the following data:
- 3K-RG (3K-Rice panGenome): (1) Basic information of the 3,010 rice accessions with short read sequencing, including accession names, sequencing depths, mapping depths on the IRGSP-1.0 genome and meta-information such as geological locations, subspecies (or subgroups) categorizations, etc. (2) Sequences and gene annotations for the 3K-RG, including a total of 50,995 (35,633 + 15,362) full-length coding genes and protein coding sequences and protein sequences of all these genes. (3) Gene presence/absence variations (PAVs). The presence/absence of genes in the rice pan-genome were determined by 453 high-quality accessions. All genes were then categorized as core, candidate core or different types of distributed genes. In total, there are 23,914 core genes, 4,986 candidate core genes and 22,095 distributed genes. Of the distributed genes, 853 genes are subspecies or varietal group specific, including 587, 147, 67 and 52 genes for Indica and Japonica subspecies, Aus and Aro groups, respectively. (4) Genome-wide expression profiles for the rice pan-genome, including expression data from 226 publicly available RNA-seq runs.
- 111-TGSRG (111-TGS-based Rice panGenome) (1) Basic information of the 111 rice accessions with long read sequencing, including accession names, sequencing depths, mapping depths on the IRGSP-1.0 genome and meta-information such as geological locations, subspecies (or subgroups) categorizations, etc. (2) Sequences and gene annotations for the 111-TGSRG, including a total of 82,643 (63,324 + 19,319) full-length coding genes and protein coding sequences and protein sequences of all these genes. (3) Gene element presence/absence variations (PAVs). The presence/absence of genes and elements in the rice pan-genome were determined by 111 high-quality accessions. All genes and elements were then categorized as core, candidate core or different types of distributed ones.
- 326-TGSRG (326-Rice Graph panGenome): (1) Basic information of the 326 rice accessions with genomes assemblied using long read sequencing, including accession names and meta-information such as subspecies (or subgroups) categorizations, etc. (2) Graph structure for 326-TGSRG, including a total of 63,324 full-length coding genes with small variants (SNP/INDEL) and large variants (SV) of all these genes. (3) Sequence node presence/absence variations (PAVs) in graph pangenome.
RPAN2 includes the following functions:
- Basic search & filter functions:
- Search a single gene (with its gene ID) to obtain its basic information, distributions, PAVs in three pangenomes.The pangenome browser can be linked accorrding to gene IDs.
- Search a single rice accession (with its accession code) to obtain its sequencing landscape and meta-information (geological location, subspecies categorization, etc).
- Genome browser functions:
- The browser features multiple tracks: a gene annotation track, PAV tracks from SGS of 3,010 accessions, coverage tracks from SGS of 453 high-quality accessions, presence frequency tracks from five populations, and expression tracks from 226 publicly available RNA-seq datasets. By contrast, the 111-TGSRPG browser offers coverage tracks from TGS of 113 samples.
- Sequence alignment functions:
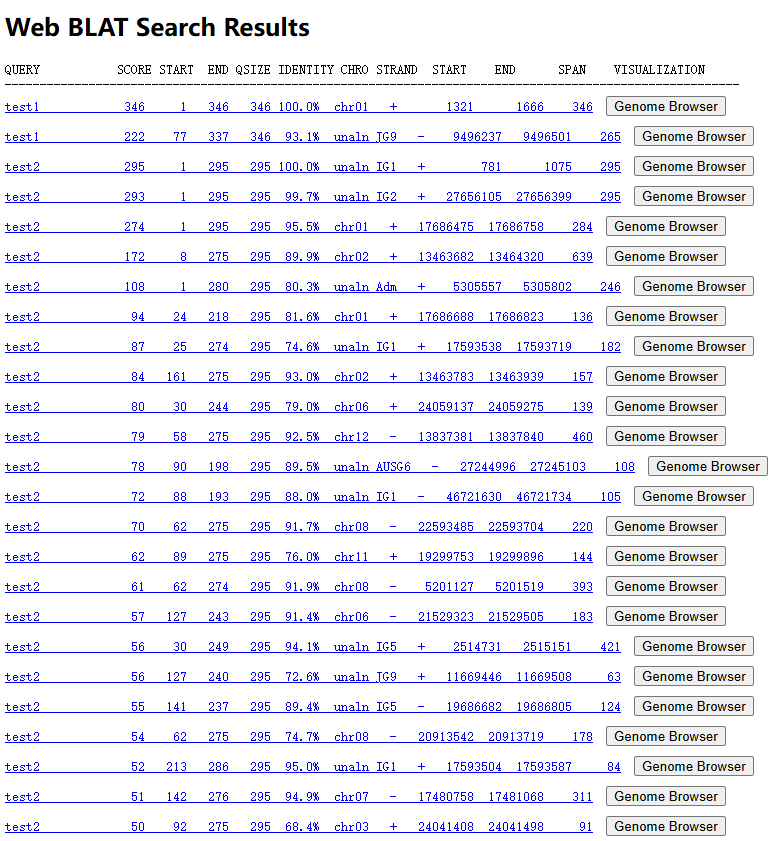
- Alignment sequence(s) against the rice pangenomes. A BLAT search server with the rice pangenome as the reference sequence was deployed in RPAN2. A sequence or multiple sequences in FASTA format can be searched. All hit regions in the rice pan-genome will be returned and can be visualized in the genome browser.
- Visualization functions:
- The genome browser was built based on JBrowse2 to visualize genome sequences, gene annotations, gene expressions, and presence-absence variations (PAVs). Users can search accession ID or any text related to the tracks information in tracks selection panel. Searched results can be saved as a custom track for a subsequent comparison.
- The gene element PAV heatmap provides more detailed information of variations.
- The graph structure of gene in graph pangenome provides global, poplulation and individual level variations.
Gene Search
Users can construct a search query by adding groups and conditions to a graphical interface to filter data.
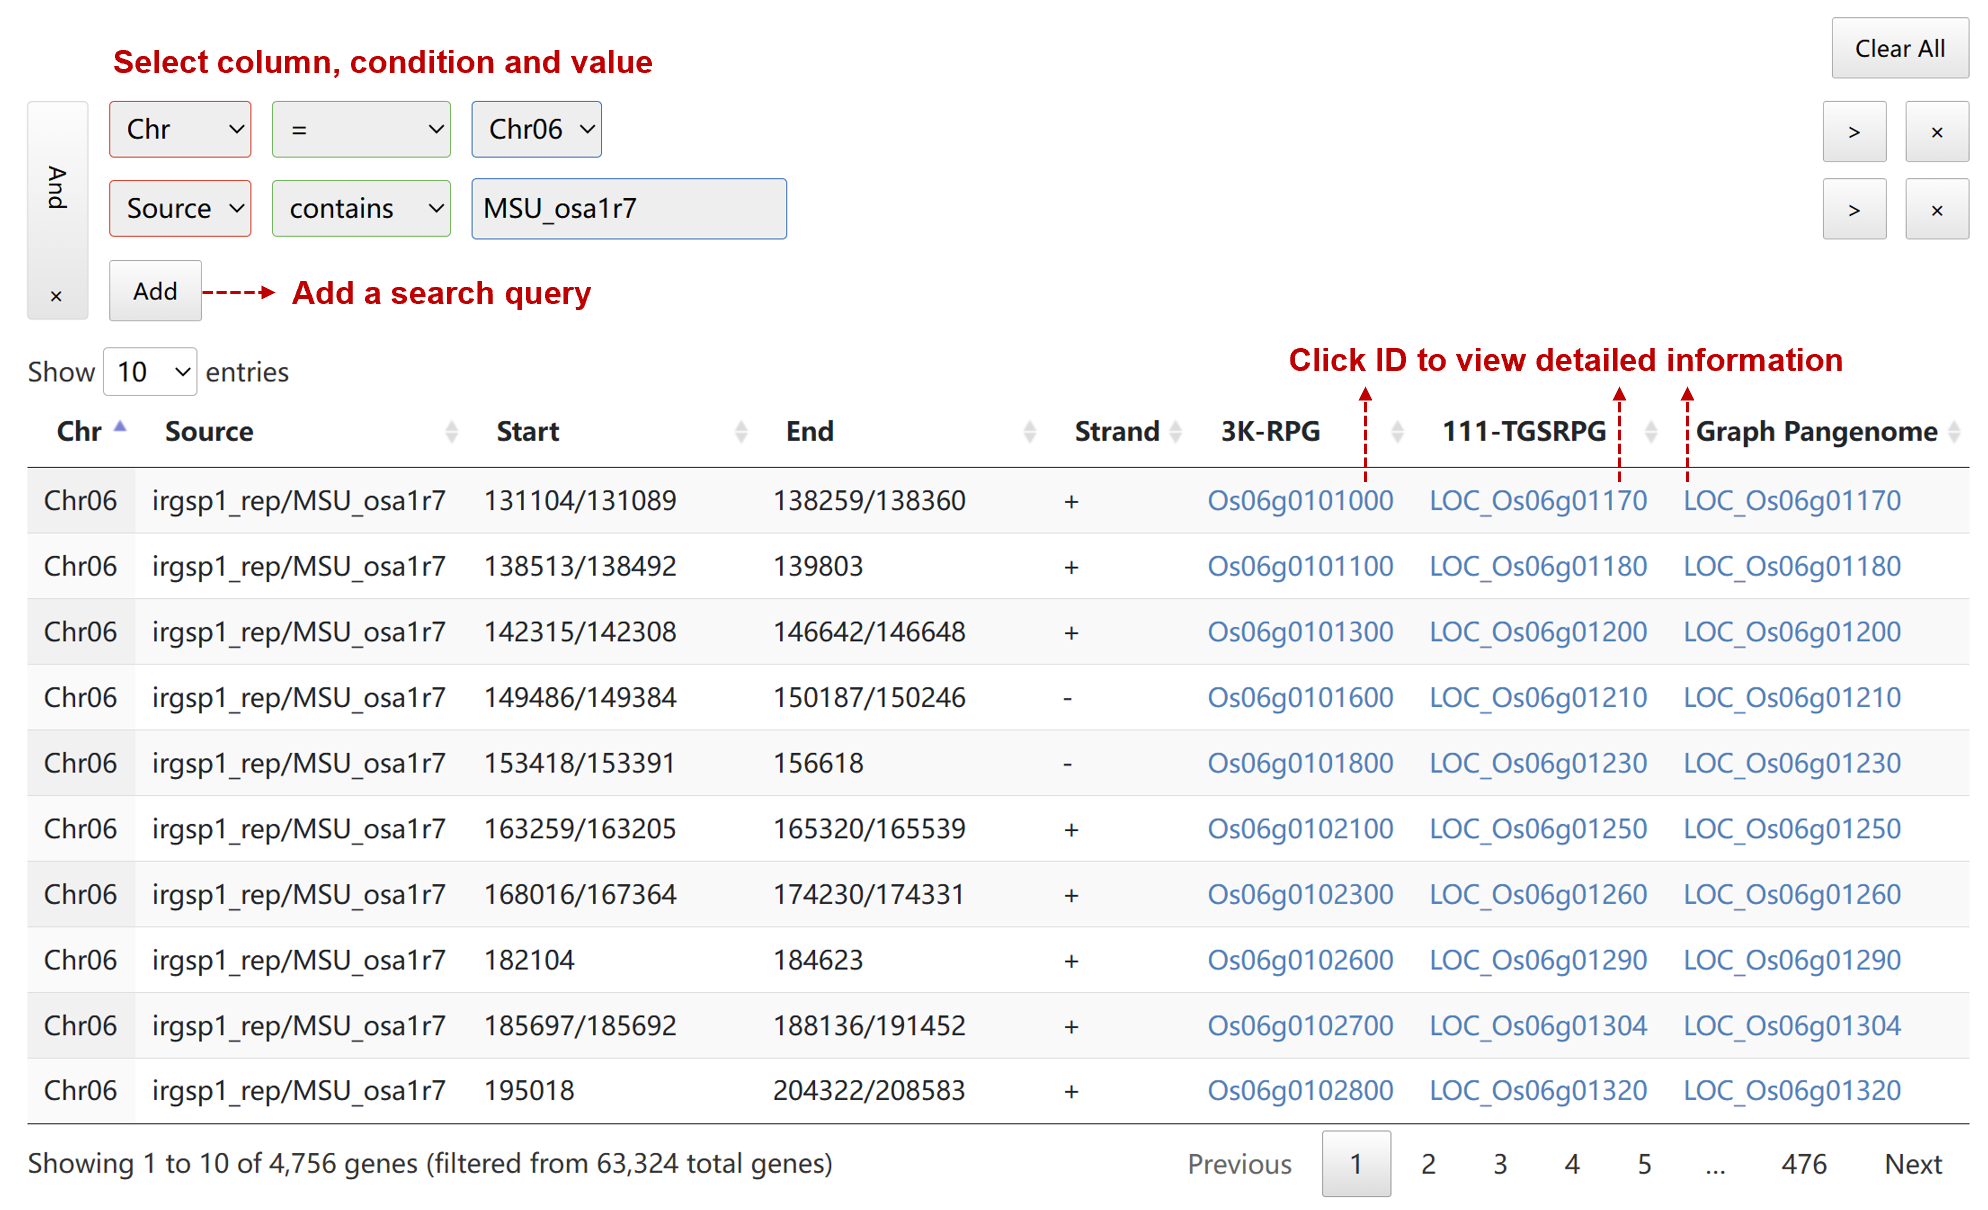
The gene table contains the following columns:
- Chr/Seq: name of the chromosome or sequence
- Source: gene annotation version
- Start: start coordinate in the chromosome or sequence
- End: end coordinate in the chromosome or sequence
- Strand: defined as + (forward) or - (reverse)
- 3K-RPG: gene id in 3k rice pangenome
- 111-TGSRPG: gene id in 111 TGS-based rice pangenome
- Graph Pangenome: gene id in rice graph-based pangenome
After clicking the gene id, a new page will display detailed information.
1. Gene information of 3K-RPG includes:
1). Basic gene information
- Gene ID: gene ID
- Chromosome: chromosome name
- Start: start coordinate
- End: end coordinate
- Strand: defined as + (forward) or - (reverse)
- View in Pangenome Browser: visualize this gene in genome browser
2). Gene categorization
All genes were categorized according to their presence/absence in the 453 high-quality accessions.
- Core genes: Genes which exist in all high-quality rice accessions
- Distributed genes: Genes which exist in significantly less than 99 % of accessions (binomial tests, p-value < 0.05, null hypothesis is “loss rate < 1 %”)
- Candidate Core genes: Genes which exist in > 99 % (not all) of high-quality rice accessions (binomial test, FDR < 0.05)
- Subspecies-unbalanced genes: Distributed genes whose frequency in one or more subspecies is significantly higher than that in other subspecies (Fisher’s test, FDR < 0.05)
- Indica-dominant genes: Subspecies-unbalanced genes whose frequencies in Indica are 5 % greater than their frequencies in Japonica
- Japonica-dominant genes: Subspecies-unbalanced genes whose frequencies in Japonica are 5 % greater than their frequencies in Indica
- Subspecies-specific genes: Distributed genes which exist in a subspecies but are absent in all other subspecies
- Indica-specific genes: genes only exist in Indica
- Japonica-specific genes: genes only exist in Japonica
- AUS-specific genes: genes only exist in AUS
- ARO-specific genes: genes only exist in ARO
- Subgroup-unbalanced genes: Distributed genes whose frequency in one or more sub-groups of a subspecies is significantly higher than the frequencies in other sub-groups in this subspecies
- Indica-subgroup-unbalanced genes: Distributed genes which are abundant (or have significantly higher frequencies) in specific Indica subgroup(s) but have low frequencies in the other Indica subgroup(s) (Fisher’s test, FDR < 0.05)
- Japonica-subgroup-unbalanced genes: Distributed genes which are abundant (or have significantly higher frequencies) in specific Japonica subgroup(s) but have low frequencies in the other Japonica subgroup(s) (Fisher’s test, FDR < 0.05)
- Random genes: Distributed genes which show no difference among groups and sub-groups (genes are not core, candidate core, subspecies unbalanced and sub-group unbalanced)
3). Gene distribution
The phylogenetic tree was constructed based on PAVs among 453 high quality accessions.
Through the gene distribution tree of single gene search result, users could find the presence of this gene on phylogenetic tree directly. Users could also compare this tree with the tree with classification and geographical distribution labeled below.
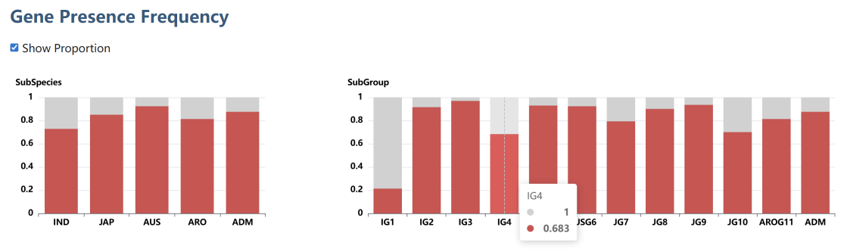
4). Gene presence frequency
The two bar plots illustrate the presence frequency of the gene across 453 high-quality accessions, categorized by subspecies and by subgroup, respectively.
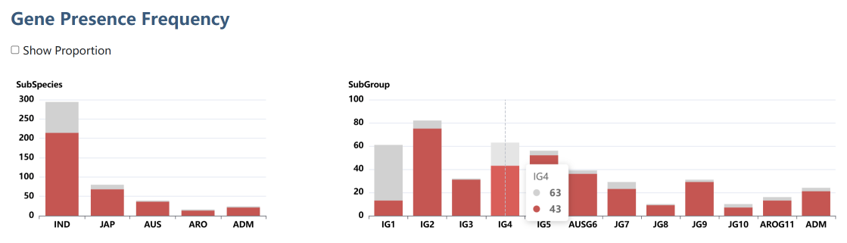
Check the "Show Proportion" box to display percentage values.
5). Gene ontology
GO term ID and name of this gene. Users can click the ID to get detailed information.
6). Sequence
Coding DNA sequence and protein sequence in FASTA format.
2. Gene information of 111-TGSRPG includes:
1). Basic gene information
- Gene ID: gene ID
- Chromosome: chromosome name
- Start: start coordinate
- End: end coordinate
- Strand: defined as + (forward) or - (reverse)
- View in Pangenome Browser: visualize this gene in genome browser
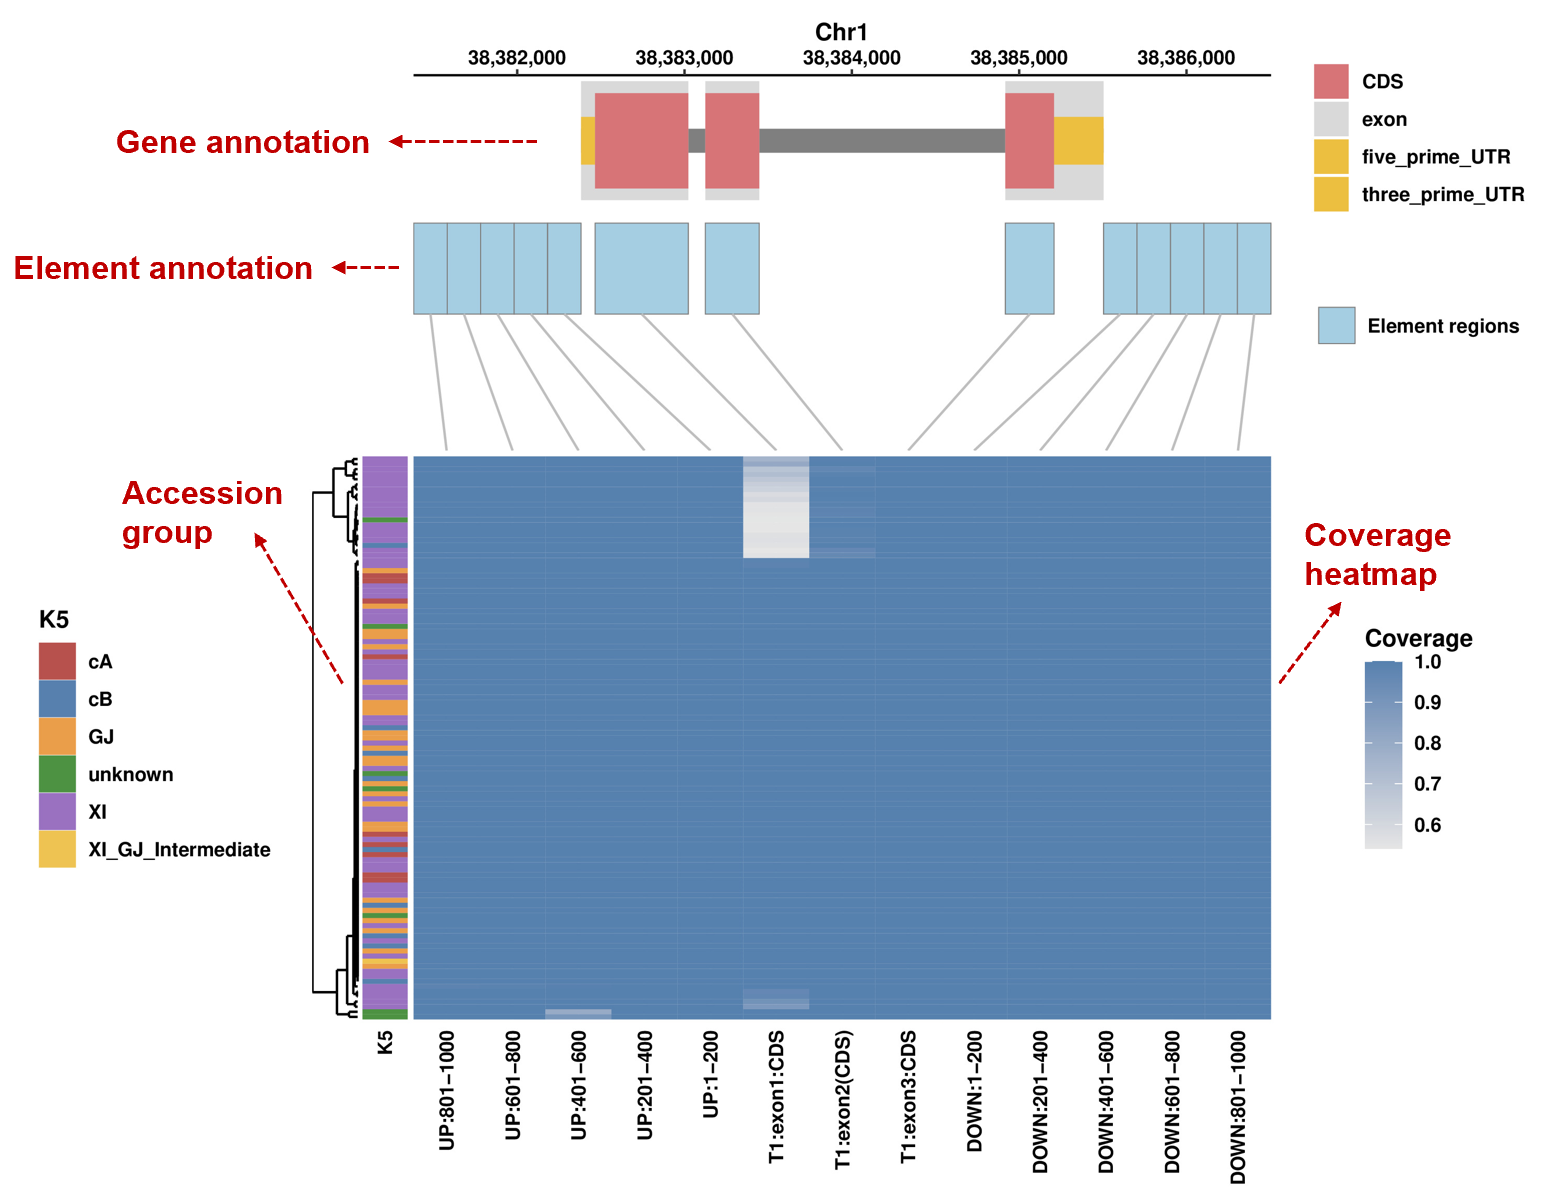
2). Element coverage
It shows gene annotation at the top, followed by element annotation, and the coverage of each element across all accessions, with accession group annotation on the right.
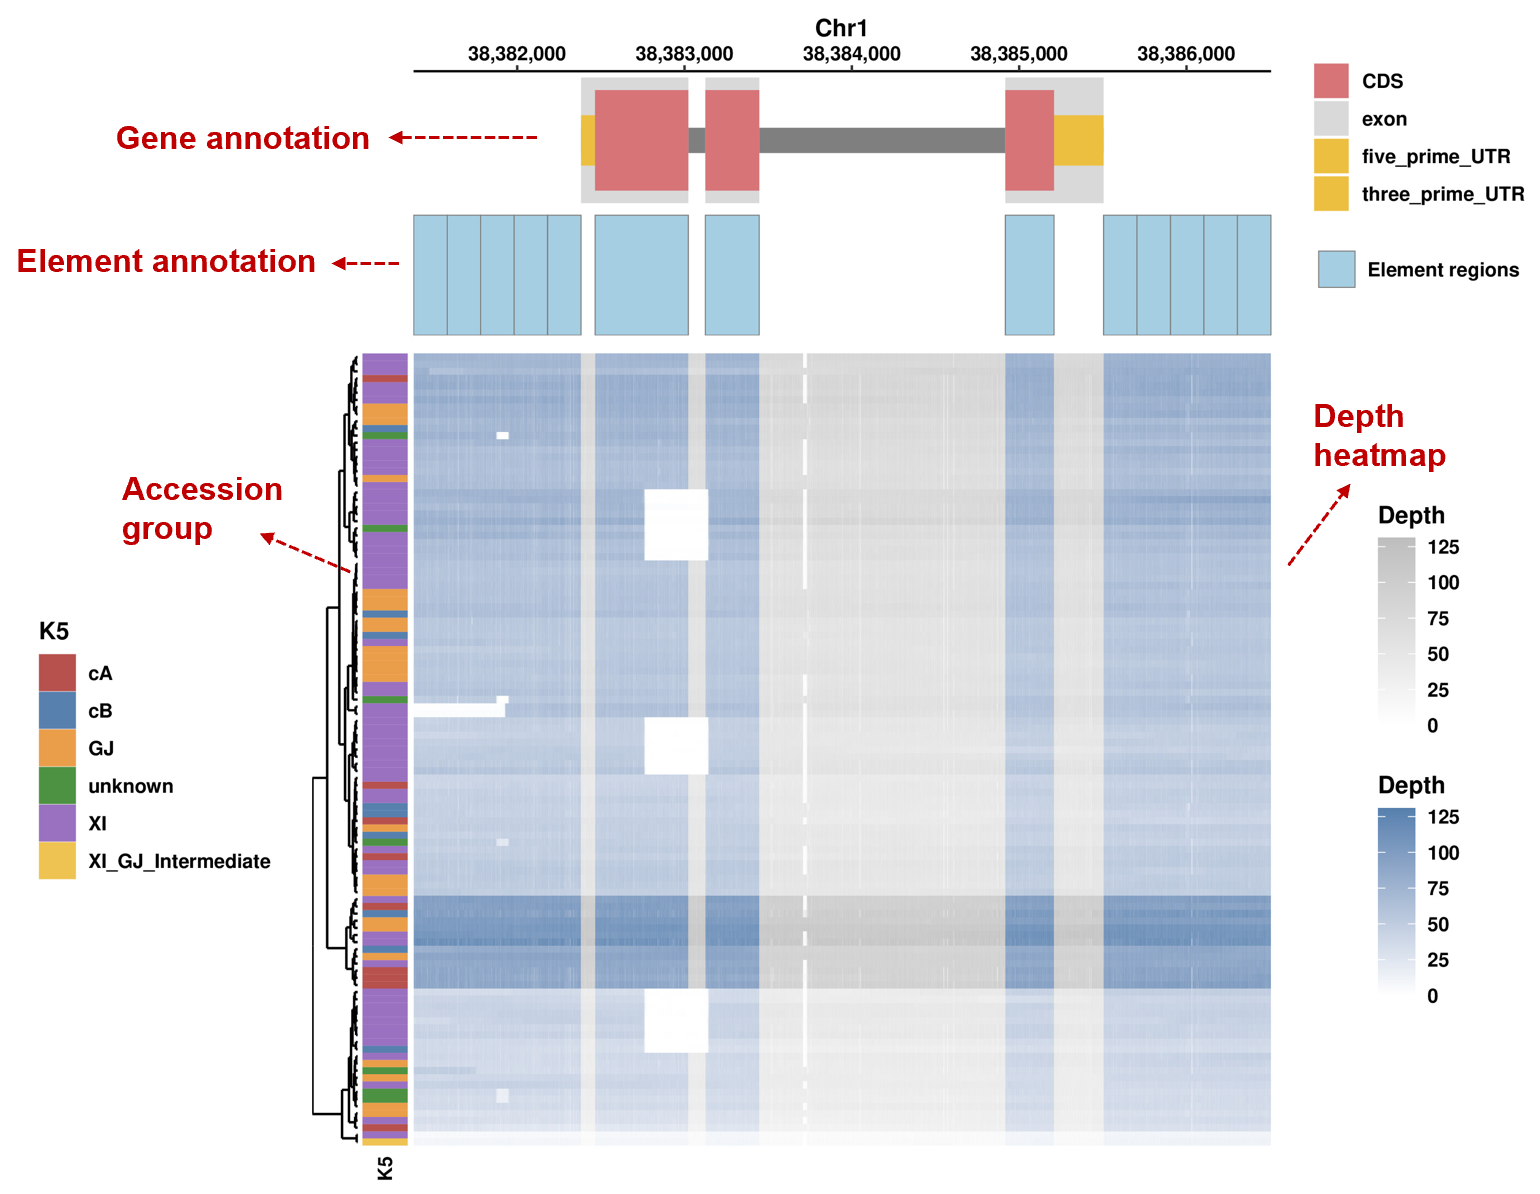
3). Depth
It shows gene annotation at the top, followed by element annotation, and per-base read-depth across all accessions, with accession group annotation on the right. Blue blocks indicate element regions; gray blocks indicate other regions.
3. Gene information of graph pangenome includes:
1). Basic gene information
- Gene ID: gene ID
- Chromosome: chromosome name
- Start: start coordinate
- End: end coordinate
- Strand: defined as + (forward) or - (reverse)
2). Comprehensive Overview
The gray and blue colors represent reference genome sequences, with blue indicating gene regions and gray for flanking regions. Red indicates non-reference sequences.
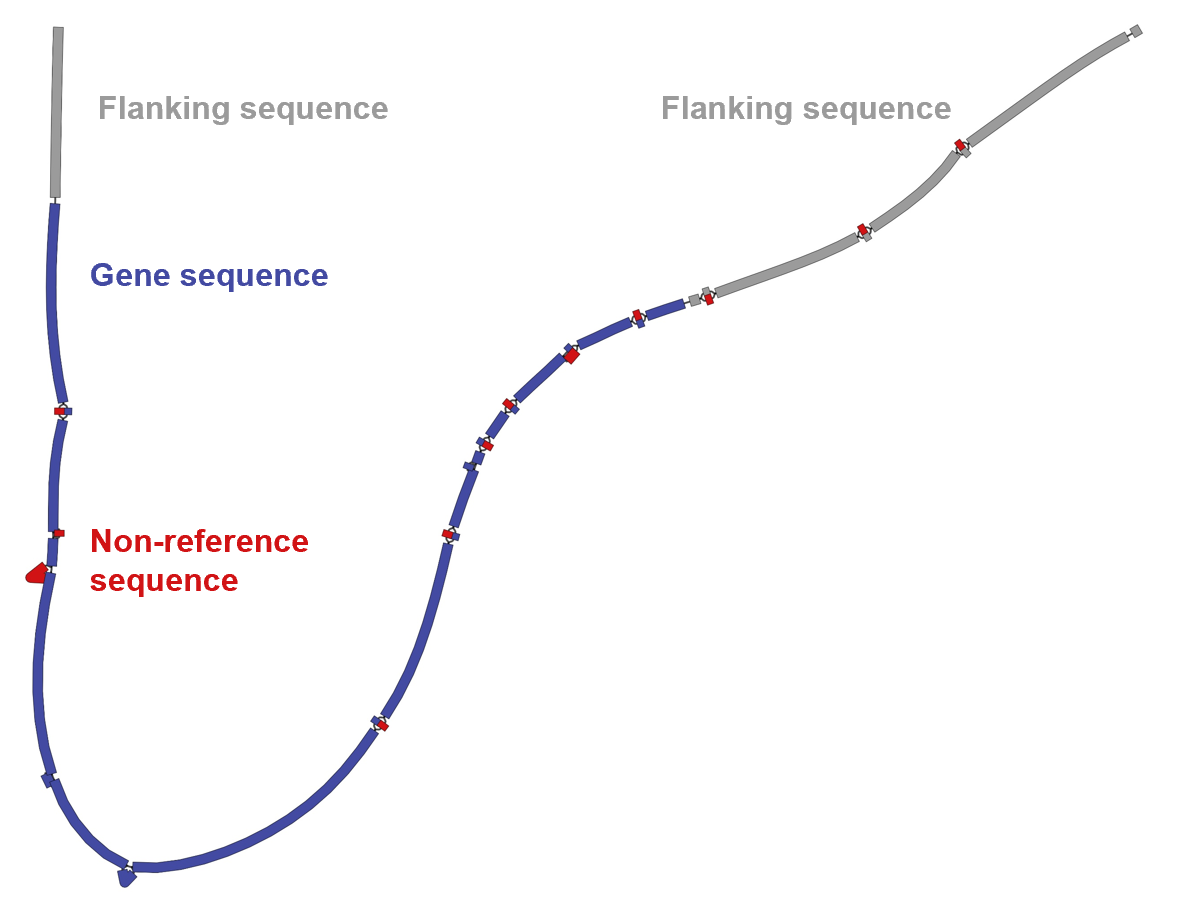
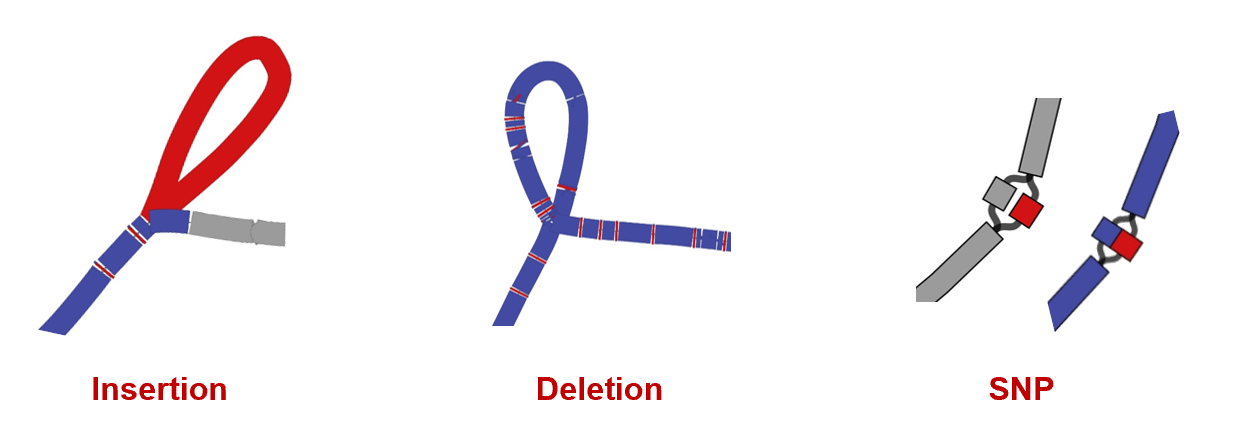
Insertions, deletions, and SNPs can be observed from the topological structure of the network diagram.
3). Population Insights
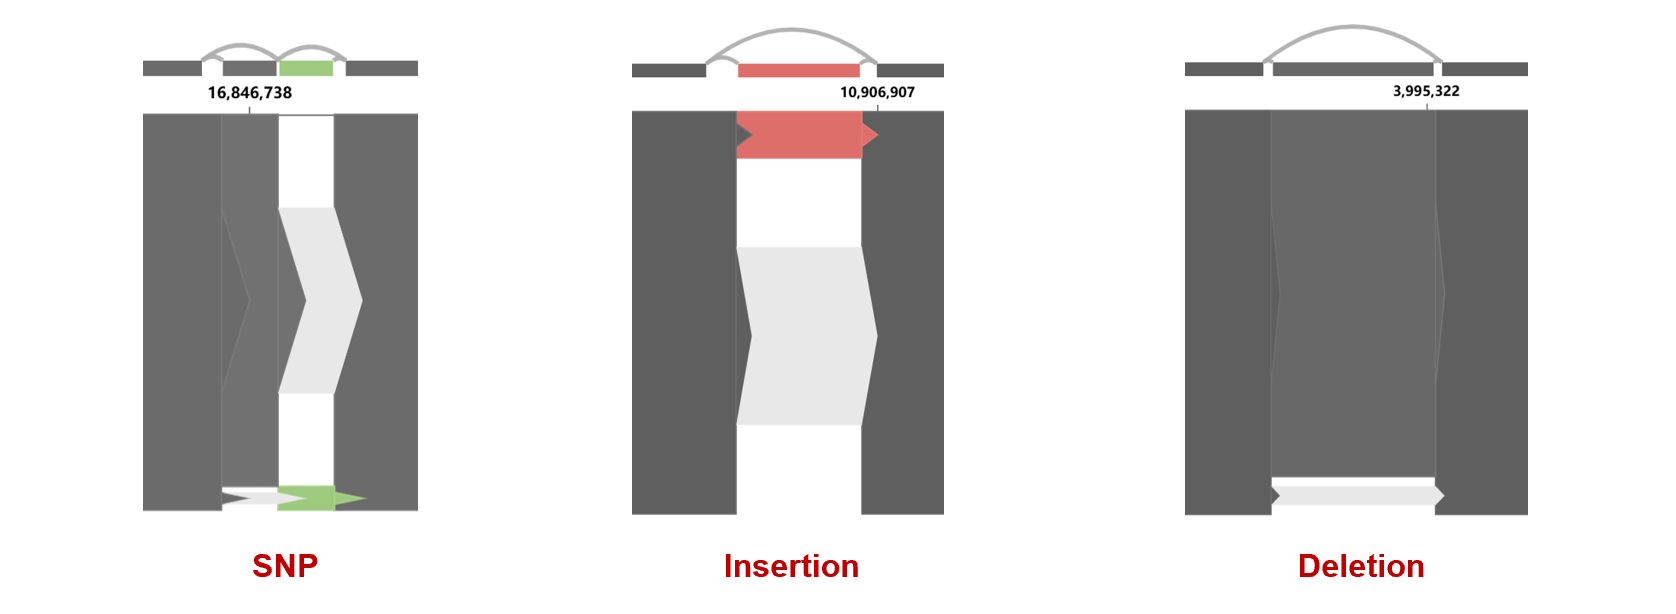
The upper blocks display sequences, using grayscale for reference sequences and color for non-reference sequences. The light-gray bands between blocks represent the edges. The lower track provides gene annotation.
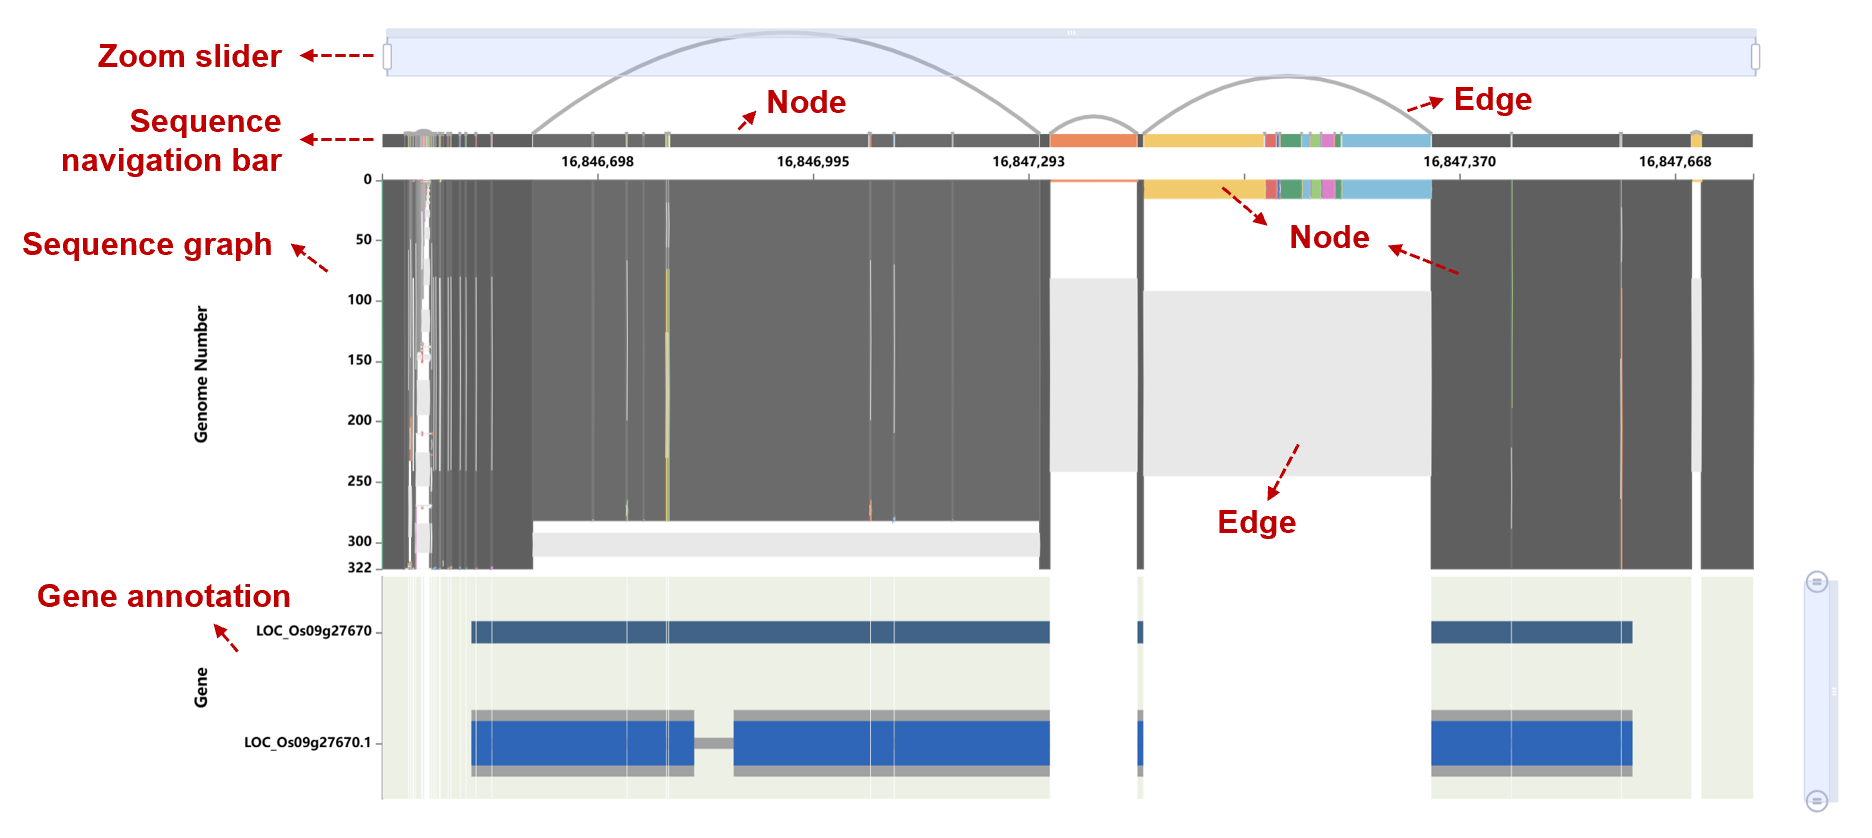
Insertions, deletions, and SNPs can be observed from the connections between sequence blocks.
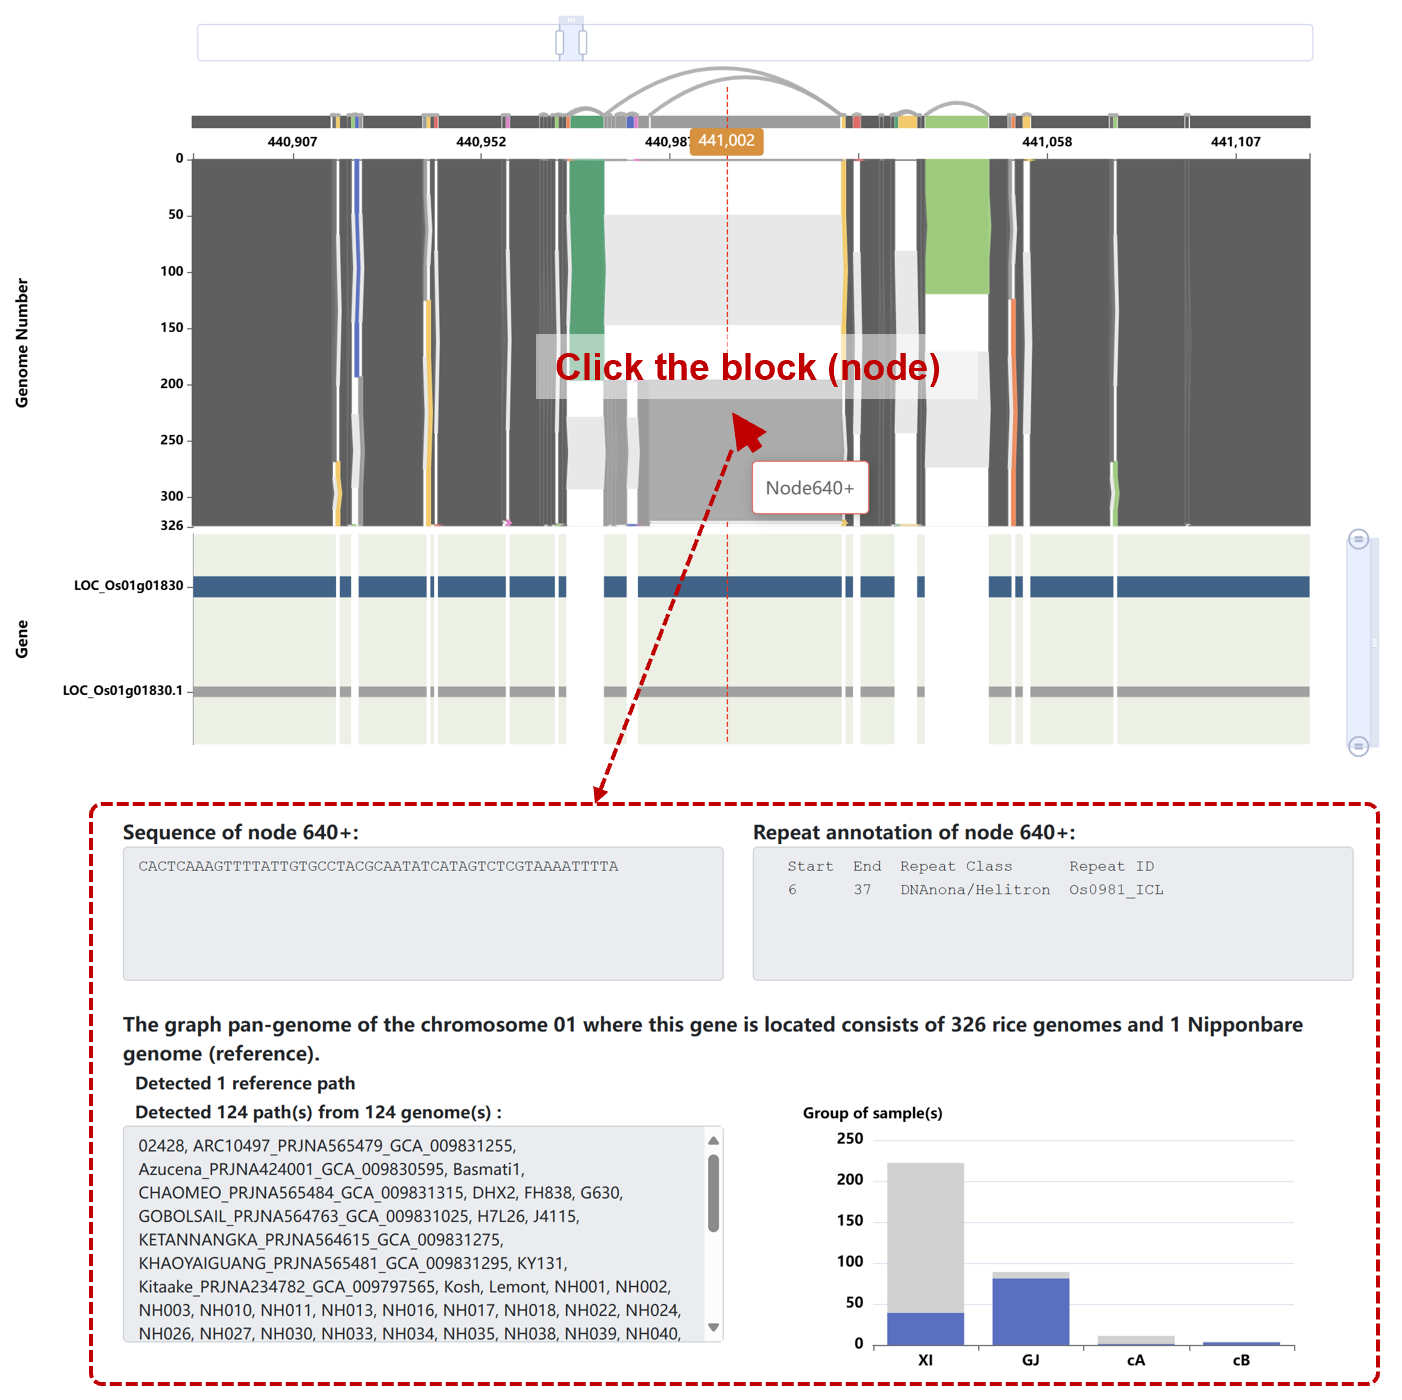
Click any block (sequence node) in the figure to see its sequence, repeat annotations, path information, and subpopulation distribution. In the bar chart, the gray bars represent the total count, and the blue bars represent the number of genomes contained within the current node. The statistics in the bar chart do not include the reference genome.
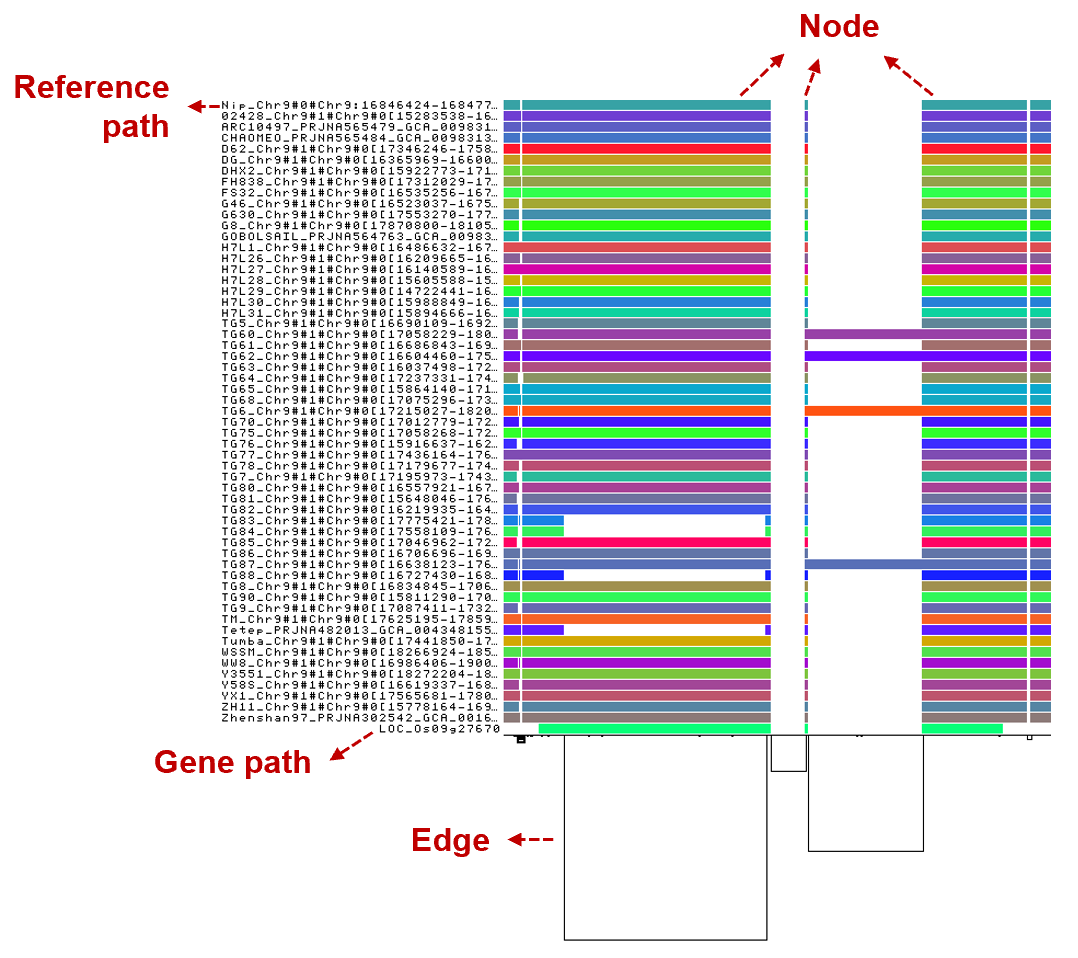
4). Individual Case Results
Colored blocks represent sequences, while the black connecting lines below function as edges. The bottom path highlights the gene.
Sample Search
There are three sample tables: a table of genomes for constructing the linear pan-genome, transcriptome samples from different tissues of rice, and a table of genomes for constructing the graph-based pan-genome.
1. Sample table for linear pangenome
The samples in the table were used to construct the 3K Rice Pan-Genome and the 111 TGS Pan-Genome. The table contains the following columns:
- ID: sample number
- Sample ID (3k): sample identifier in the 3,000 Rice Genomes Project
- Sample ID (111TGS): sample identifier in 111-TGS rice pangenome
- Accession name: name of the rice accession
- Accession name synonym: alternative name of the rice accession
- Other name: additional common, local, or vernacular names for the sample
- Region: region of the rice accession, including AFR(Africa), AME(America), EAS(East Asia), EUR(Europe), OCE(Oceania), SAS(South Asia), SEA(Southeast Asia), WAS(West Asia), WEU(West Europe), NA(not available)
- Country: source country of the accession
- Platform: sequencing platform used to generate genomic data
- K5: five subpopulations of rice accseesions, including XI(Xian/Indica), GJ(Geng/Japonica), cA(circum-Aus group), cB(circum-Basmati group) and Admix
- K9: nine subpopulations of rice accseesions, including four XI clusters (XI-1A from East Asia, XI-1B of modern varieties of diverse origins, XI-2 from South Asia and XI-3 from Southeast Asia), three GJ clusters (GJ-tmp primarily from East Asian temperate, GJ-sbtrp from Southeast Asian subtropical and GJ-trp from Southeast Asian tropical), cA and cB from South Asian. Accessions with admixture components <0.65 within XI and GJ were classified as ‘XI-adm’ and ‘GJ-adm’, respectively, and accessions that fell between major groups were classified as admixed
- Subspecies (3k): subspecies categorization by SNP analysis assigned within the 3K project, including JAP(japonica), IND(indica), AUS(aus/boro), ADM(admixed), ARO(aromatic basmati/sadri)
- Subgroup (3k): subgroup categorization by SNP analysis assigned within the 3K project, including subgroups (IG1, IG2, IG3, IG4, IG5) of subspecies Indica, AUSG6, four subgroups (JG7, JG8, JG9, JG10) of subspecies Japonica, AROG11 and admixtures (Adm)
- Accession number: official IRGC ID
- Ancestral information: pedigree or parentage
Users can construct a search query by adding groups and conditions to a graphical interface to filter data.
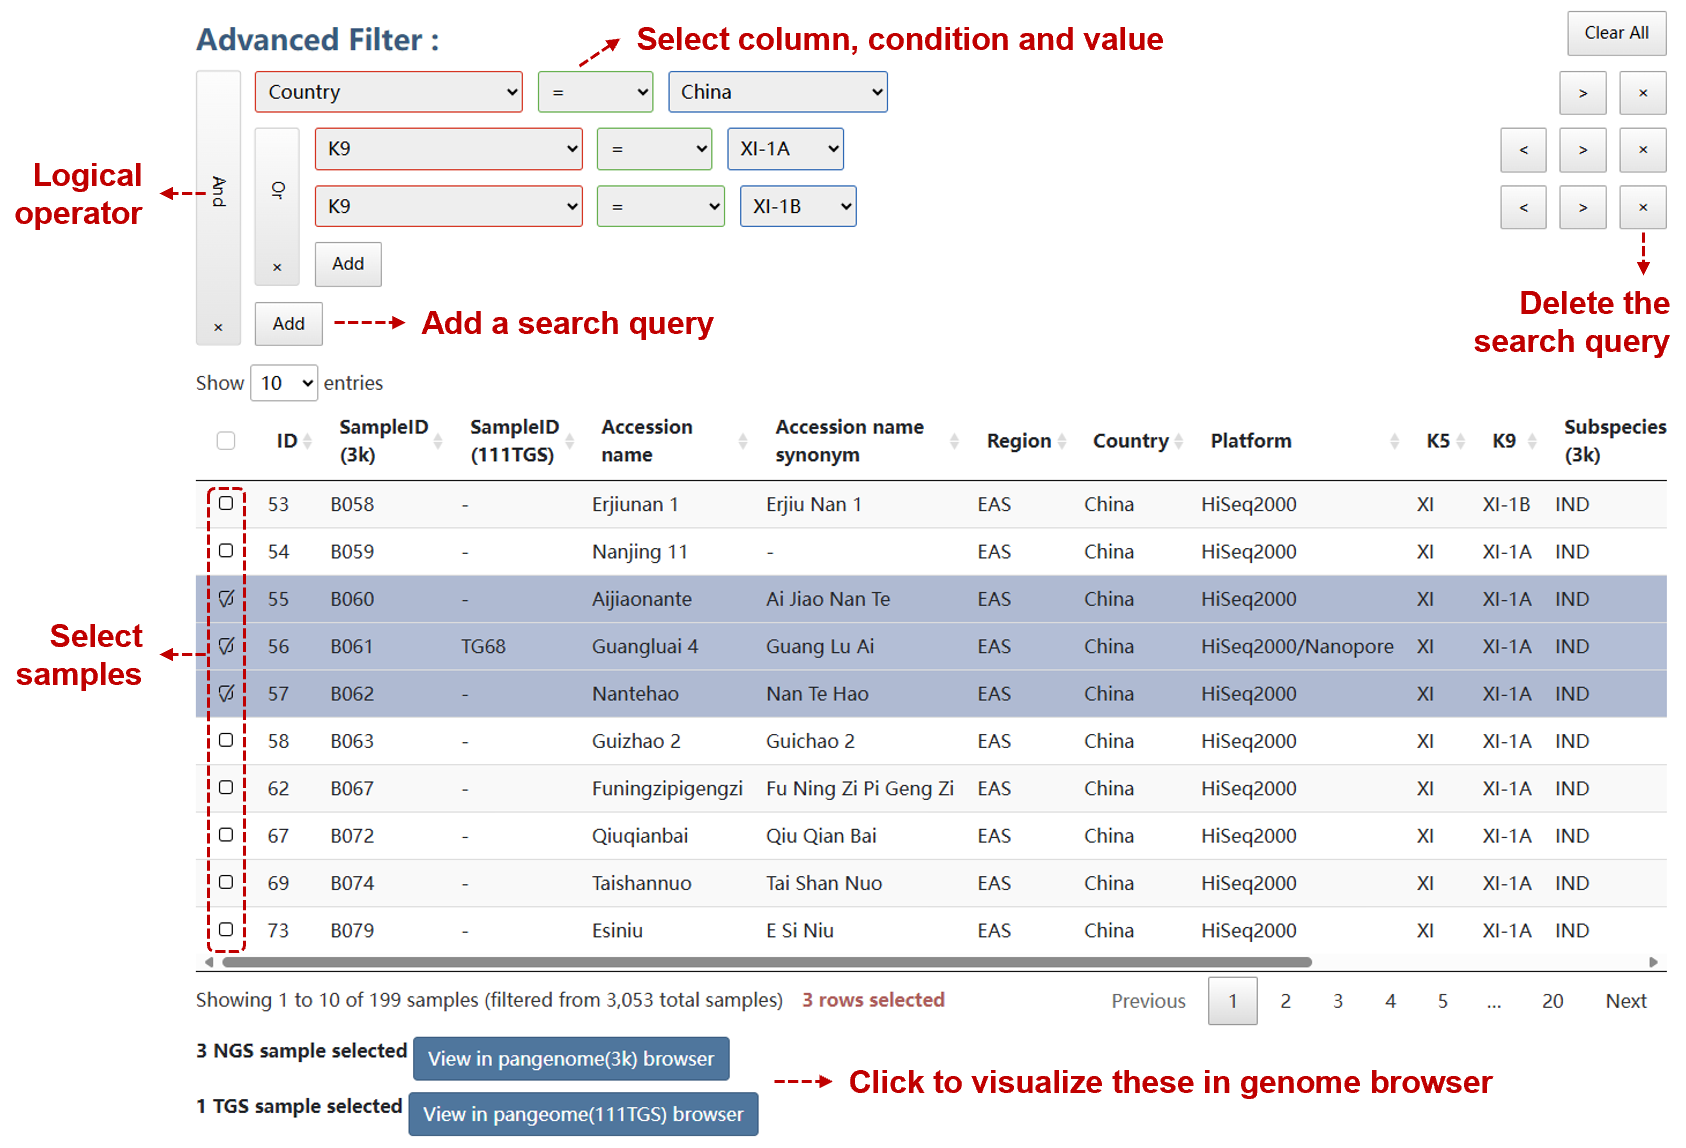
Click the button below to view the data in the corresponding genome browser.
2. Expression Profile Table
A total of 226 runs of RNA-seq data from diverse rice tissues were collected. The detailed information of gene expression profiles could be acquired and visualized in the genome browser.
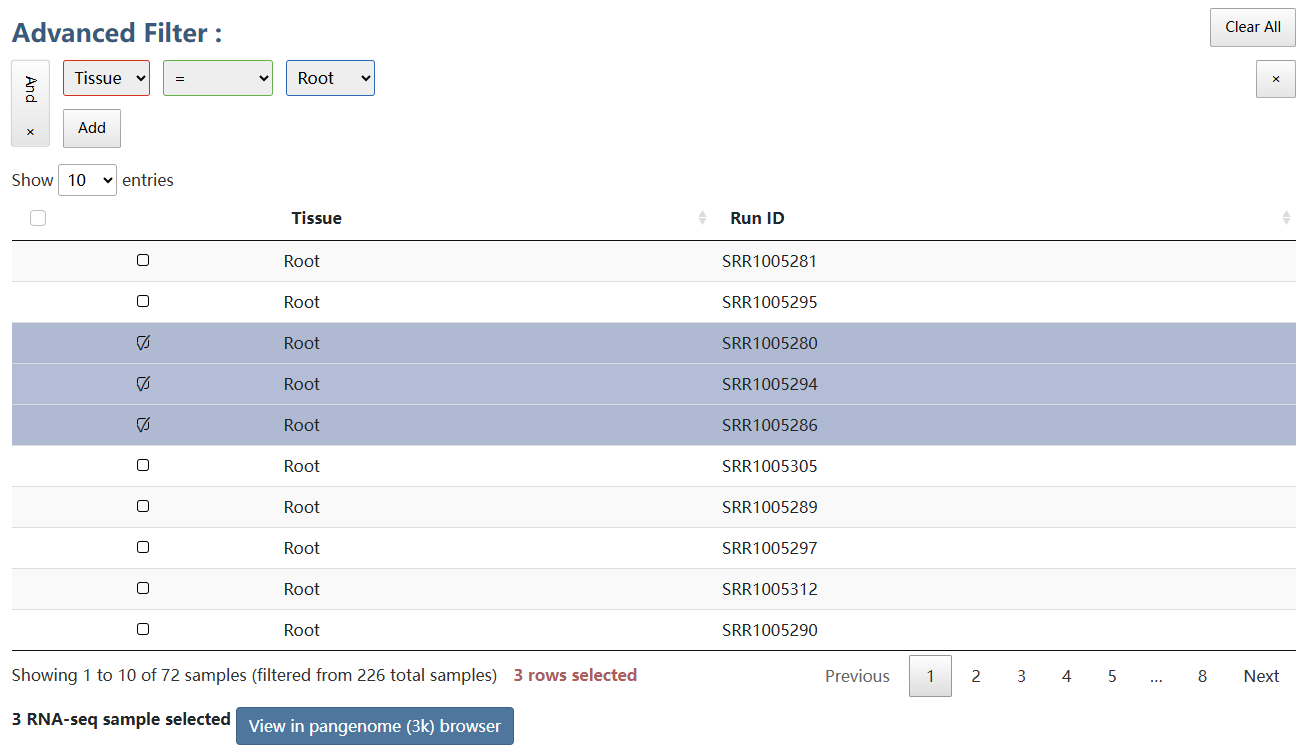
Click the button below to view the data in genome browser of the 3k rice pangenome.
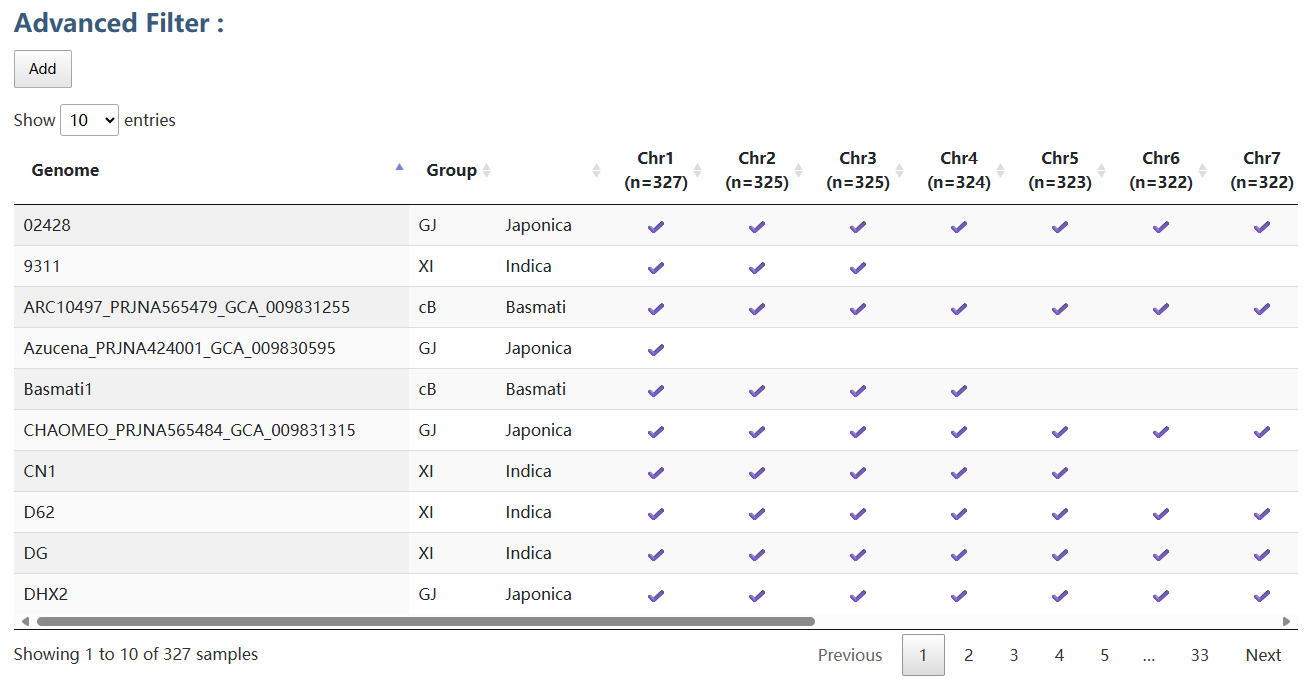
3. Sample table for graph pangenome
Genome assemblies for graph pangenome construction were collected mainly from rice accessions in previous studies. For each chromosome, assemblies whose chromosome sequence length or k-mer profile was an outlier were excluded from the analysis. The retained assemblies are marked with checkmarks in the table and were used to construct the graph pangenome.
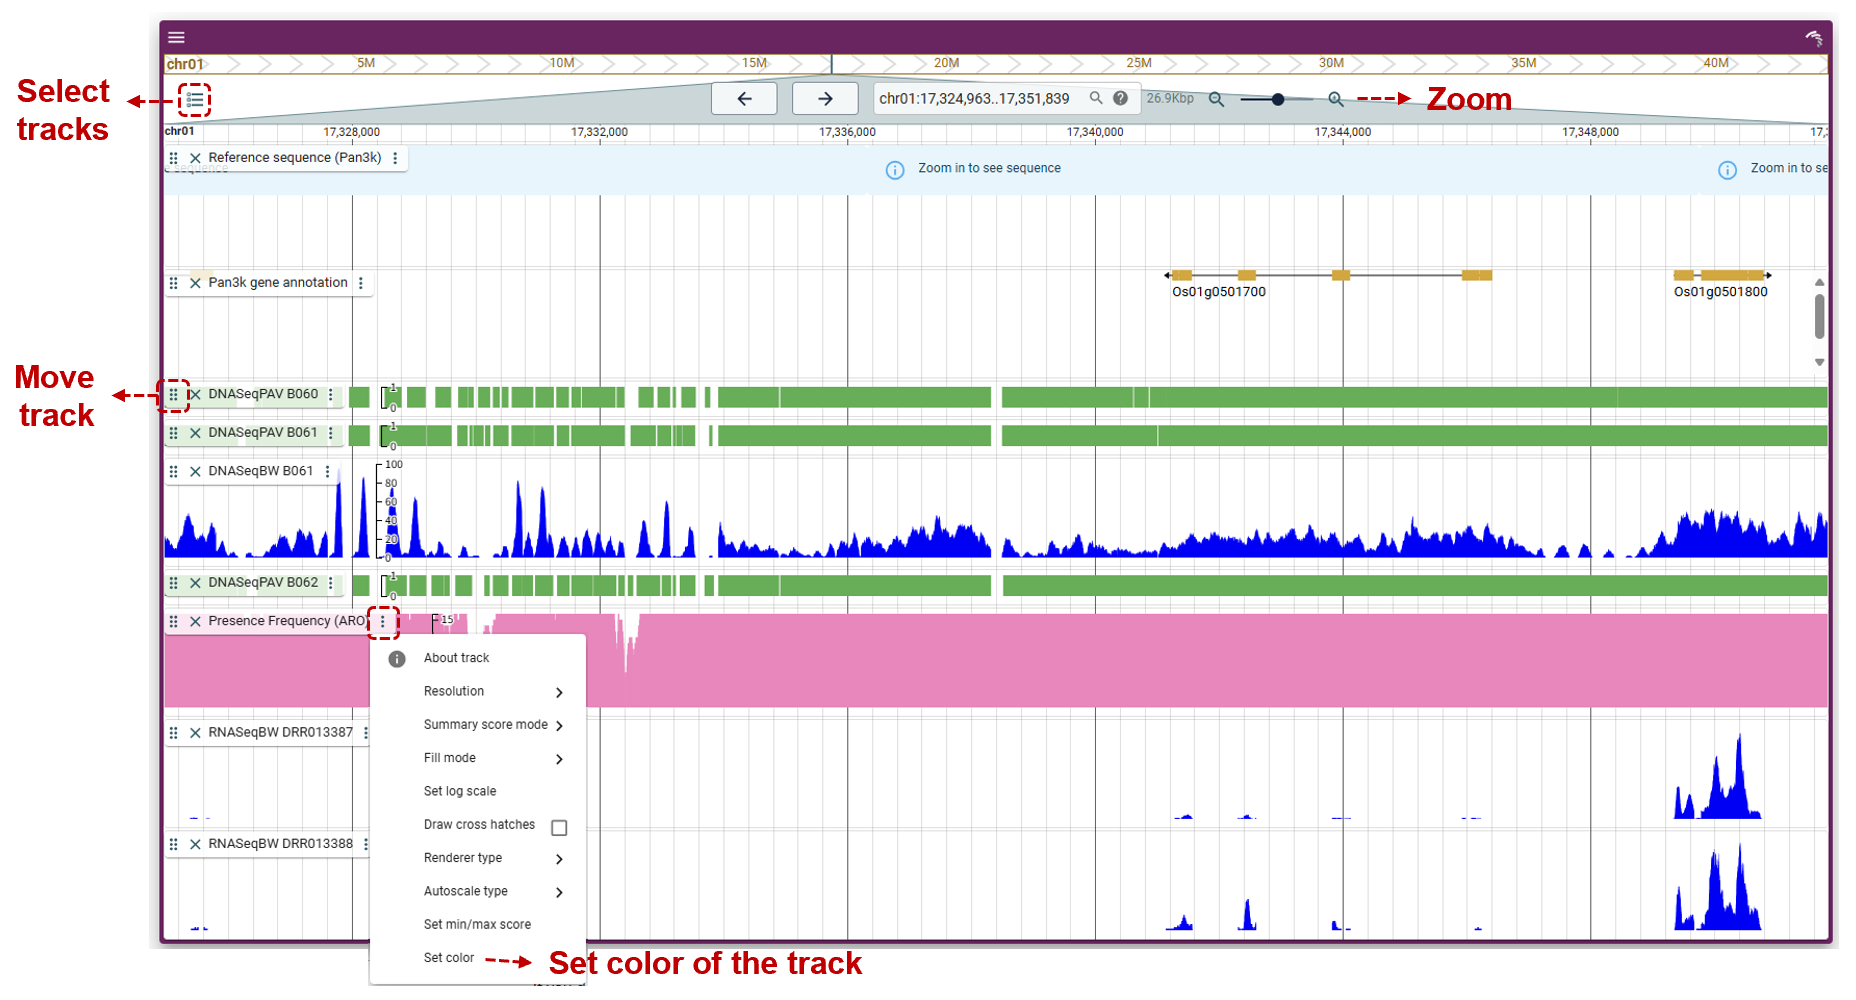
Linear Genome Browser
We provide two genome browsers for both the 3K rice pangenome and 111-TGS rice pangenome, integrating pan-genome sequences, annotations, and sequencing data.
The 3K-RG rice pan-genome browser offers the following tracks:
- Reference sequence: the pan-genome sequence. Users could zoom in to see sequence at base level.
- Gene annotation track: the pan-genome gene annotation.
- Presence frequency tracks: the presence frequency of high quality accession. There are five tracks, including the presence frequency of overall, JAP, IND, ARO and AUS.
- PAV tracks: 3,010 accession tracks.
- Coverage tracks: alignment coverage of 453 high quality accessions.
- Expression tracks: expression data from 226 publicly available RNA-seq runs.
The 111 TGS rice pan-genome browser offers the following tracks:
- Reference sequence: the pan-genome sequence. Users could zoom in to see sequence at base level.
- Gene annotation track: the pan-genome gene annotation. Users could left-click genes to search in RPAN and right-click to view detailed information.
- Coverage tracks: alignment coverage of 113 genomes.
The genome browser was based on JBrowse2. The detailed usage of JBrowse2 could be acquired in the JBrowse official site.
Sequence alignment
We provide sequence alignment for both the 3K rice pangenome and 111-TGS rice pangenome, integrating pan-genome sequences with BLAT.
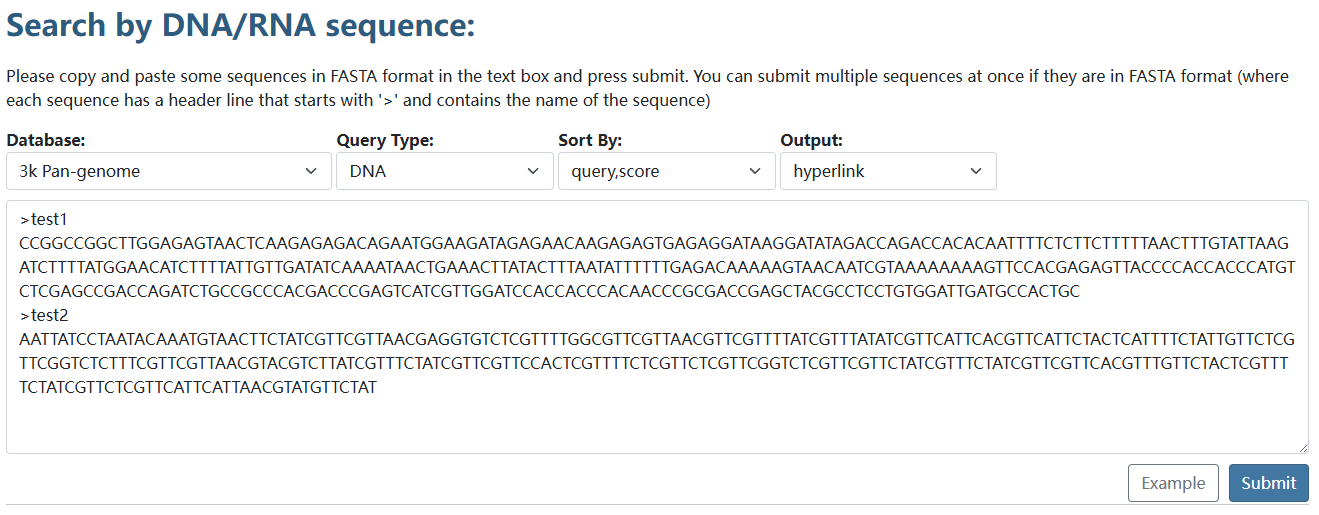
After sequences are submitted, the results with links of genome browser will be displayed.