APAV: An advanced pangenome analysis and visualization toolkit
APAV is an advanced pan-genome analysis and visualization toolkit for genomic presence-absence variations. It accepts the GFF file of genes and the BED file of any target regions. It takes map-to-pan strategy and computes coverage of target regions at the whole level and element level. You can review and check all PAVs and samples in the automatically generated interactive web reports. Based on the PAV table, APAV also offered various subsequent analysis and visualization functions, including basic statistics, sample clustering, genome size estimation, and phenotype association analysis.
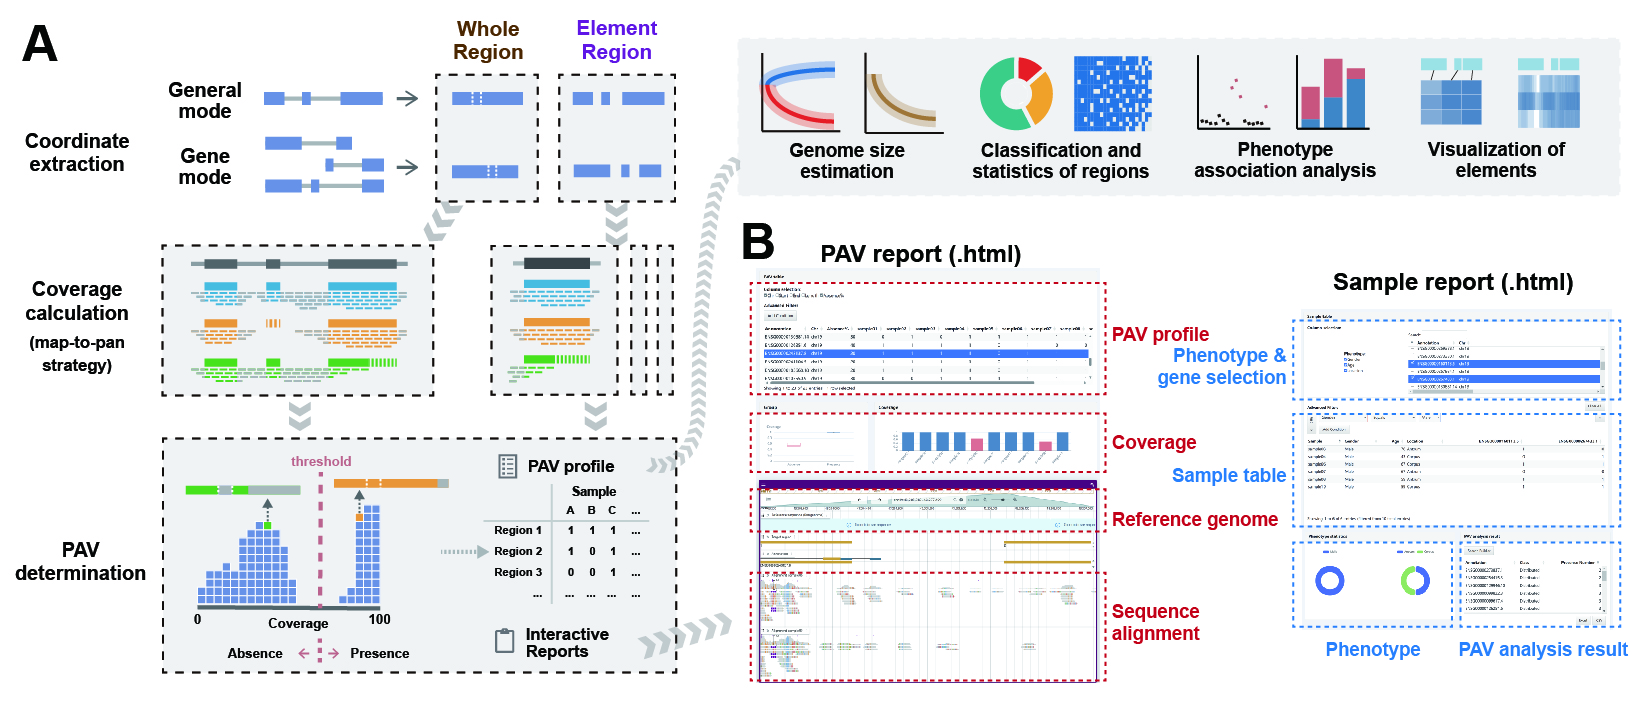
The workflow of APAV. The blue commands represent the main steps of the analysis and calculation, while the green commands are the visualization tools. Input files include a GFF file (for gene structures), a BED file (for arbitrary genomic regions), BAM files (for read alignment results), and a table of phenotypic information (for genotype-phenotype association study). The GFF or BED file is used to define the regions for statistical analysis. The staCov command computes the coverage based on the BAM files within the regions defined by the GFF or BED file. The callPAV command determines PAV based on the coverage data. The gFamPAV command determines the PAV information for gene families. The pavSize command estimates the genome size. The pavStaPheno command performs phenotypic association analysis. The results from each analysis step are accompanied by corresponding visualization methods.