A listing of all commands can be obtained with apav --help or apav -h. The usage information for each command can be shown with the --help or -h option after each sub-command name.
We prepare three demos in the demo/ directory for you to try.
Integrated commands
The main steps can be automatically executed with the geneBatch/generalBatch command. The geneBatch command is used for gene regions and takes the GFF file as input. The generalBatch command is used for any target region and takes the BED file as input.
cd ${APAV_PATH}/demo/

## demo1: Some genes on human chromosome 19
apav geneBatch --gff demo1_gene.gff3 --bamdir bam --pheno demo_sample.pheno --fa demo.fa.gz --fam demo1_gene.fam --up_n 10 --down_n 10 --chrl demo1.chrl --out demo1

## demo2: Some proteins on human chromosome 19
apav generalBatch --bed demo2_general.bed --bamdir bam --pheno demo_sample.pheno --fa demo.fa.gz --out demo2

## demo3: Some repeat sequences on human chromosome 19
apav generalBatch --bed demo3_general.bed --bamdir bam --pheno demo_sample.pheno --fa demo.fa.gz --rmele --out demo3
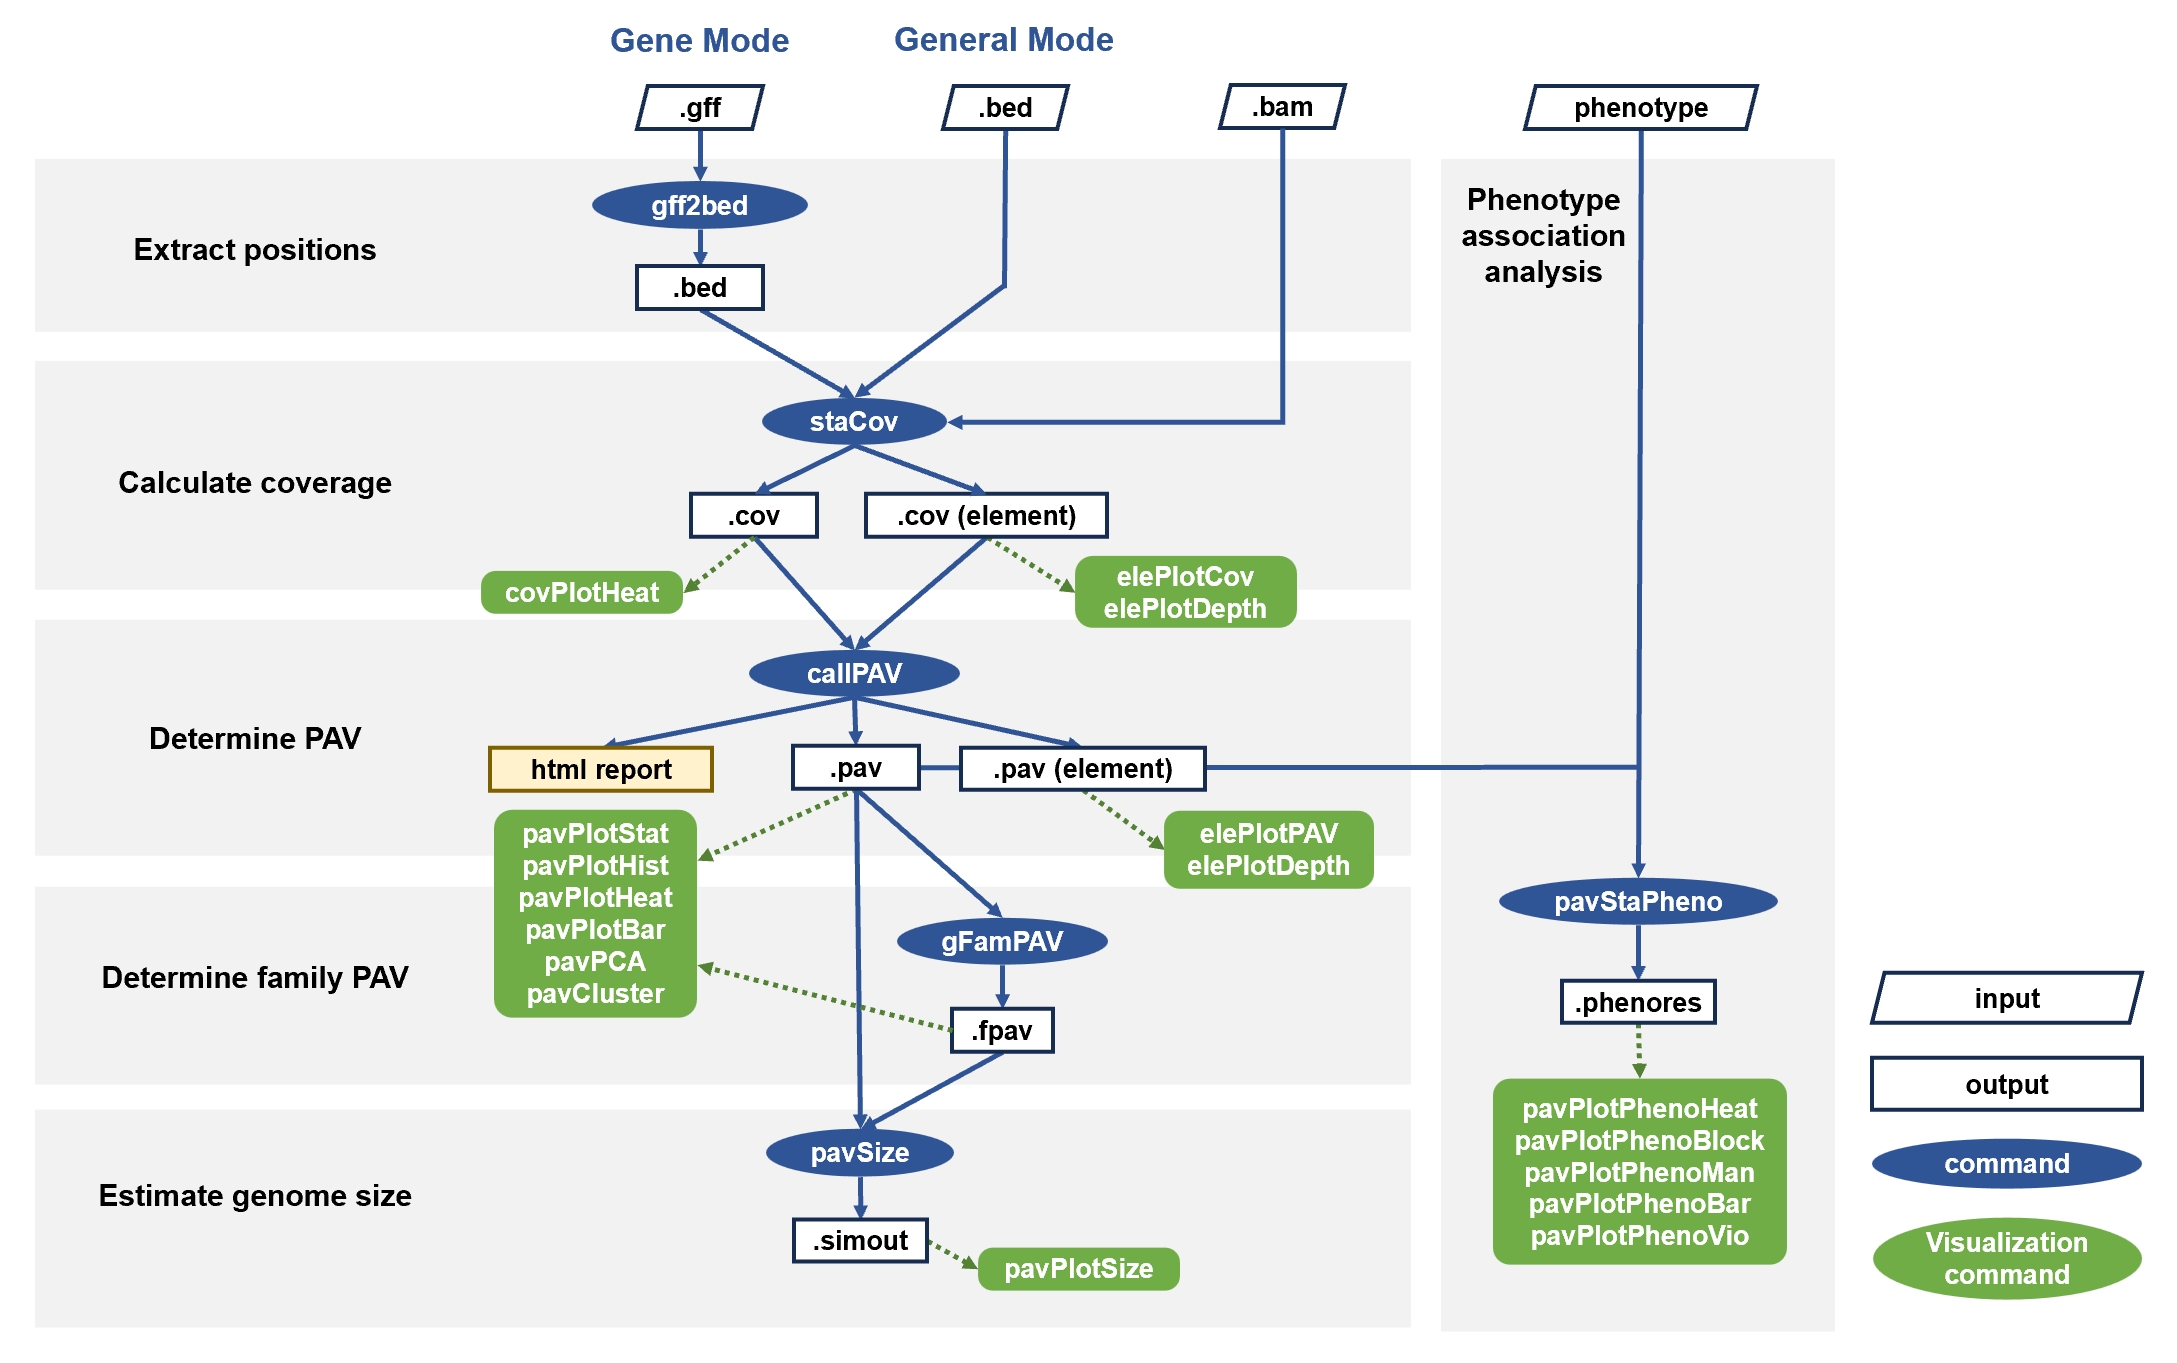
Step-by-step commands
1. Coordinate extraction
For genes, you need to use the gff2bed command to extract coordinates of genes, genetic elements and bins in upstream/downstream. It merges elements with the same coordinates and outputs them in BED format. For general target region, skip this step.
apav gff2bed --gff demo1_gene.gff3 --out demo1.bedOptions
--chrl, --up_n, --up_bin, --down_n, --dwon_bin are used for extract elements in upstream and downstream.
apav gff2bed --gff demo1_gene.gff3 --chrl demo1.chrl --up_n 10 --up_bin 100 --down_n 10 --down_bin 100 --out demo1.bed
2. Coverage calculation
Use the staCov command to compute the coverage of regions. It counts the percentage of covered bases in the whole region and each element region.
apav staCov --bed demo1.bed --bamdir bam --asgeneThe
covPlotHeat command will plot a heatmap to give an overview of coverage profile.
apav covPlotHeat --cov demo1.cov
3. PAV determination
Based on the coverage, the callPAV command determines the presence-absence variation. It generates PAV profiles and two interactive web reports.
apav callPAV --cov demo1.cov --pheno demo_sample.pheno --fa demo.fa.gz --gff demo1_gene.gff3
apav callPAV --cov demo1_ele.cov --pheno demo_sample.pheno
4. Gene family PAV determination
For genes, the gFamPAV command allows further determination of gene family PAV profile.
apav gFamPAV --pav demo1_all.pav --fam demo1_gene.fam
5. Genome size estimation
Based on PAV table, you can use the pavSize command to estimate genome size by simulating the size of pan-genome and core-genome.
apav pavSize --pav demo1_all.pavThe
## Estimation in groups
cat demo_sample.pheno | cut -f 1,2 > demo_sample.group
apav pavSize --pav demo1_all.pav --group demo_sample.group
pavPlotSize command can draw the growth curve of genome estimation.
apav pavPlotSize --size demo1_all.size
6. Common PAV analysis and visualization
APAV provides various commands for common PAV analysis. The pavPlotStat command shows the total number of regions in all samples. The pavPlotHist command shows the classifications and distribution of regions. The pavPlotHeat command gives an overview of the PAV table. The pavPlotBar command shows the composition of each sample. The pavPCA command performs PCA analysis. The pavCluster command clusters samples based on the PAV table.
apav pavPlotStat --pav demo1_all.pav
apav pavPlotHist --pav demo1_all.pav
apav pavPlotHeat --pav demo1_all.pav
apav pavPlotBar --pav demo1_all.pav
apav pavPCA --pav demo1_all.pav
apav pavCluster --pav demo1_all.pav
7. Phenotype association analysis
Use the pavStaPheno command to determine phenotype association.
apav pavStaPheno --pav demo1_all.pav --pheno demo_sample.phenoThe
pavStaPhenoHeat command gives an overview of significantly phenotype-related regions. The pavPlotPhenoBlock command is used to display a discrete phenotypes. The pavPlotPhenoMan command draws a Manhattan plot. The pavPlotPhenoBar and pavPlotPhenoVio commands show the relationship between a certain genomic region and a certain phenotype.
apav pavPlotPhenoHeat --pav demo1_all.pav --pheno_res demo1_all.phenoresThese steps also apply to elements.
apav pavPlotPhenoBlock --pav demo1_all.pav --pheno demo_sample.pheno --pheno_res demo1_all.phenores --pheno_name Gender
apav pavPlotPhenoMan --pav demo1_all.pav --pheno demo_sample.pheno --pheno_res demo1_all.phenores --pheno_name Gender
apav pavPlotPhenoBar --pav demo1_all.pav --pheno demo_sample.pheno --pheno_name Location --region_name ENSG00000233493.3
apav pavPlotPhenoVio --pav demo1_all.pav --pheno demo_sample.pheno --pheno_name Age --region_name ENSG00000254415.3
8. Visualization of element regions
For the focused target region, you can use the elePlotCov/elePlotPAV command to observe the coverage/PAV of elements. Furthermore, the elePlotDepth command can display the read depth in target regions.
grep 'ENSG00000126251.6' demo1_gene.gff3 > ENSG00000126251.6.gff3
grep -E 'Annotation|ENSG00000126251.6' demo1_ele.cov > ENSG00000126251.6.elecov
grep -E 'Annotation|ENSG00000126251.6' demo1_ele_all.pav > ENSG00000126251.6.elepav
apav elePlotCov --elecov ENSG00000126251.6.elecov --pheno demo_sample.pheno --gff ENSG00000126251.6.gff3
apav elePlotPAV --elepav ENSG00000126251.6.elepav --pheno demo_sample.pheno --gff ENSG00000126251.6.gff3
apav elePlotDepth --ele ENSG00000126251.6.elecov  --bamdir bam --pheno demo_sample.pheno --gff ENSG00000126251.6.gff3